描述
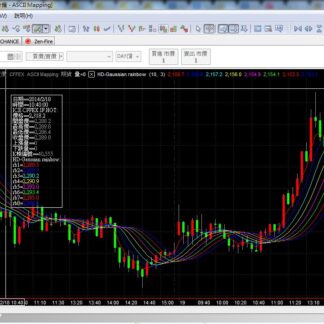
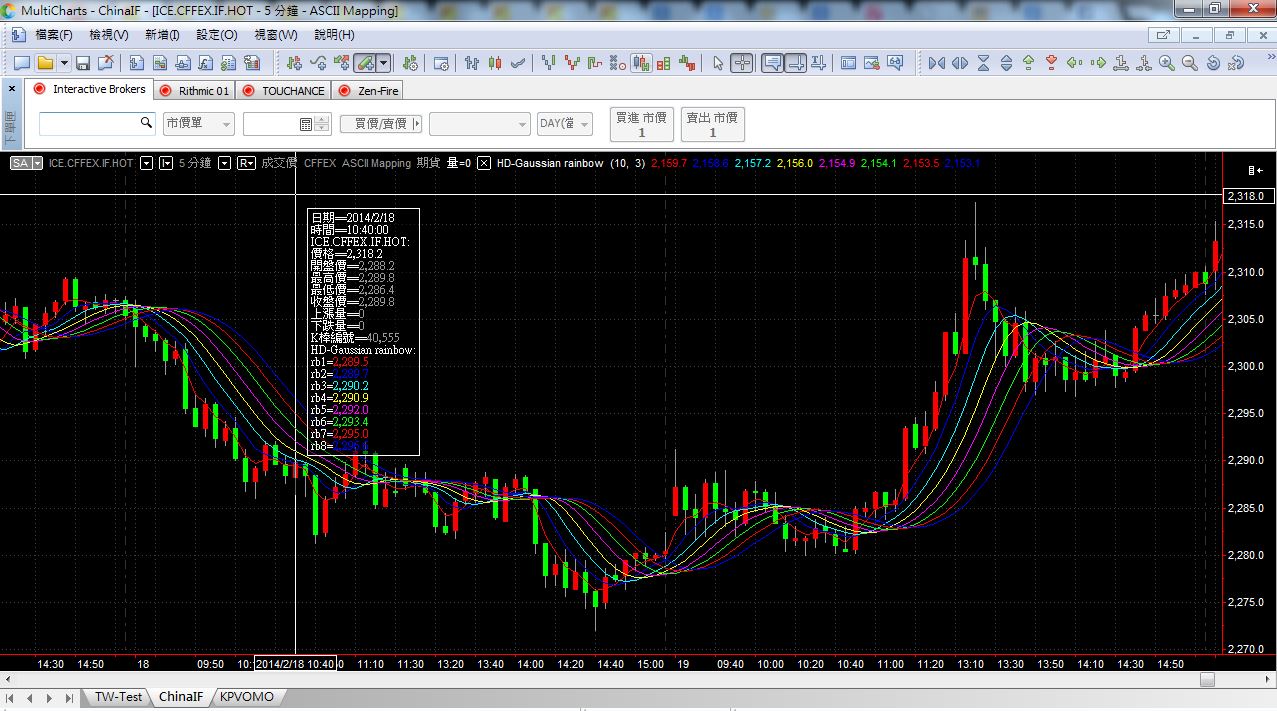
這是一個Multicharts指標,它以高斯的數學函式架構而成
輔以配合的是一個多重線圖的呈現,
可以幫助交易員發現是否趨勢慢慢地在改變了
所以它被稱為高斯彩虹(Gaussian Rainbow)指標。
This is a Multicharts indicator, which is structured as a mathematical function of Gauss.
Displayed as a multiple line graph.
It can help traders find out if the trend is slowly changing
That’s why it’s called the Gaussian Rainbow indicator.