描述
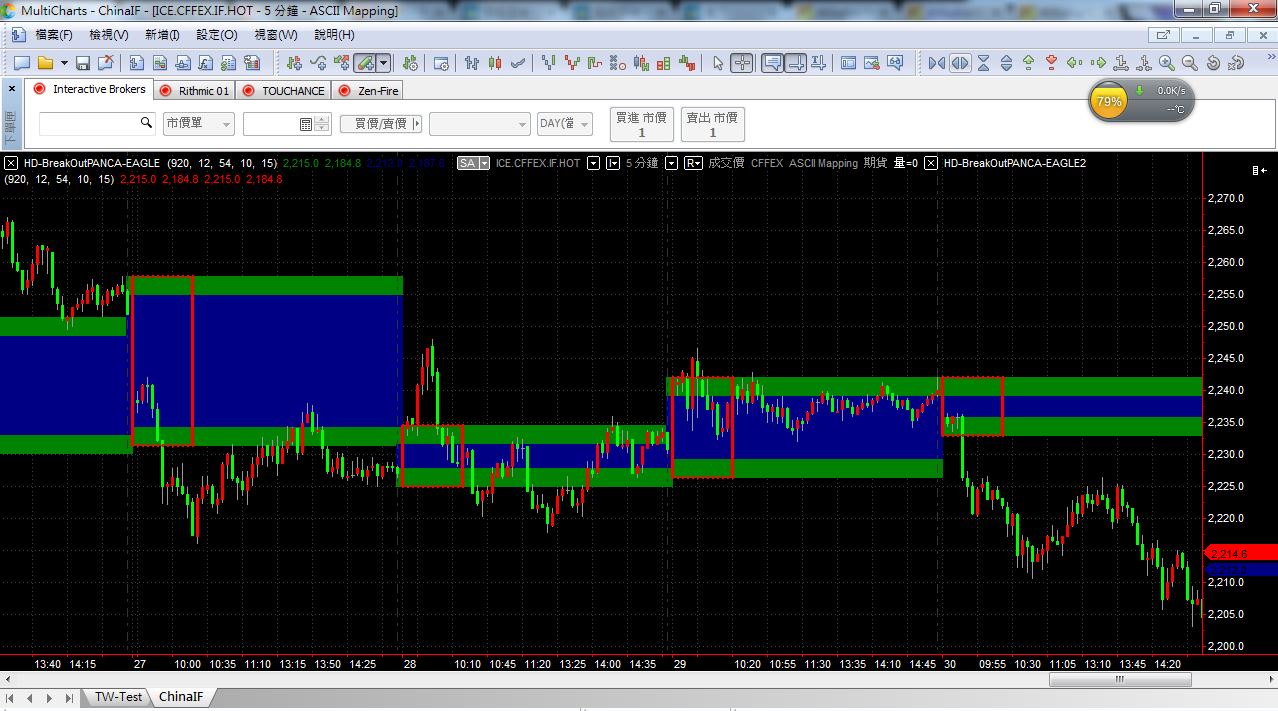
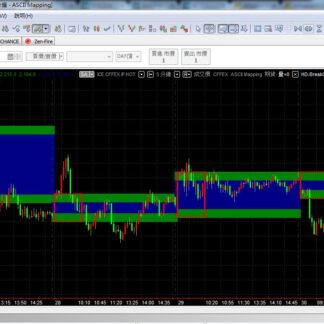
這是一個很影象化的Multicharts指標,
主要作為日內之用,但對於隔夜走勢也可以提供還不錯的參考。
它可以透過設定,抓取開盤之後某一段時間區塊,畫出矩形來,
並且在全天域的走勢中,以色帶來顯示可能的走勢範圍。
對於交易員,能夠提供一個很清楚的看盤輔助依據。
This is a very graphic Multicharts indicator.
Mainly for intraday use, but can also provide a good reference for overnight trends.
It can be set up to grab a time period after the opening and draw a rectangle.
And in the all session, the color band shows the possible range of the swing.
For traders, it provides a very clear help.
商品評價
目前沒有評價。