Order flow tools — footprint charts, volume delta and imbalance alerts — reveal the actual buying and selling inside each candle, helping traders tell whether a move is driven by real capital or is a low-volume false breakout. This toolkit is built for MultiCharts and NinjaTrader futures traders, needs tick-level data, and works best confirming entries at key price levels rather than as a standalone signal.
Xumi Order Flow Read the market like institutions
Advanced order flow toolkit for Multicharts and NinjaTrader futures traders
- Footprint chart + volume delta — see the buy/sell pressure inside every candle
- Imbalance alerts — auto-detect aggressive buy or sell clusters
- Large-order detector — spot institutional entries and exits
- Capital cost line — know the real cost basis behind the move
What is Order Flow?
Order flow is real-time data showing exactly where every buy and sell trade executed at each price, visualized as a footprint chart and volume delta. It shows whether buyers or sellers were the aggressor behind a given candle and whether an imbalance or large order hit the tape — information a plain candlestick close can never show.
What is order flow?
Order flow is real-time trade-by-trade data on where buying and selling actually executed at each price, shown via a footprint chart and volume delta. It reveals which side was the aggressor behind a candle and whether there was an imbalance or large-order entry, going beyond what the closing price alone can tell you.
What do I need to learn to trade order flow?
Three core concepts: (1) the footprint chart — volume traded at every price inside a candle; (2) volume delta — aggressive buy volume minus aggressive sell volume; (3) imbalance — price levels where one side dominates. Xumi Order Flow integrates all three into MultiCharts and NinjaTrader.
Order Flow Tools
Sharper Trading Decisions Through Order Flow
XUMI ORDER FLOW
 Xumi Footprint Chart | 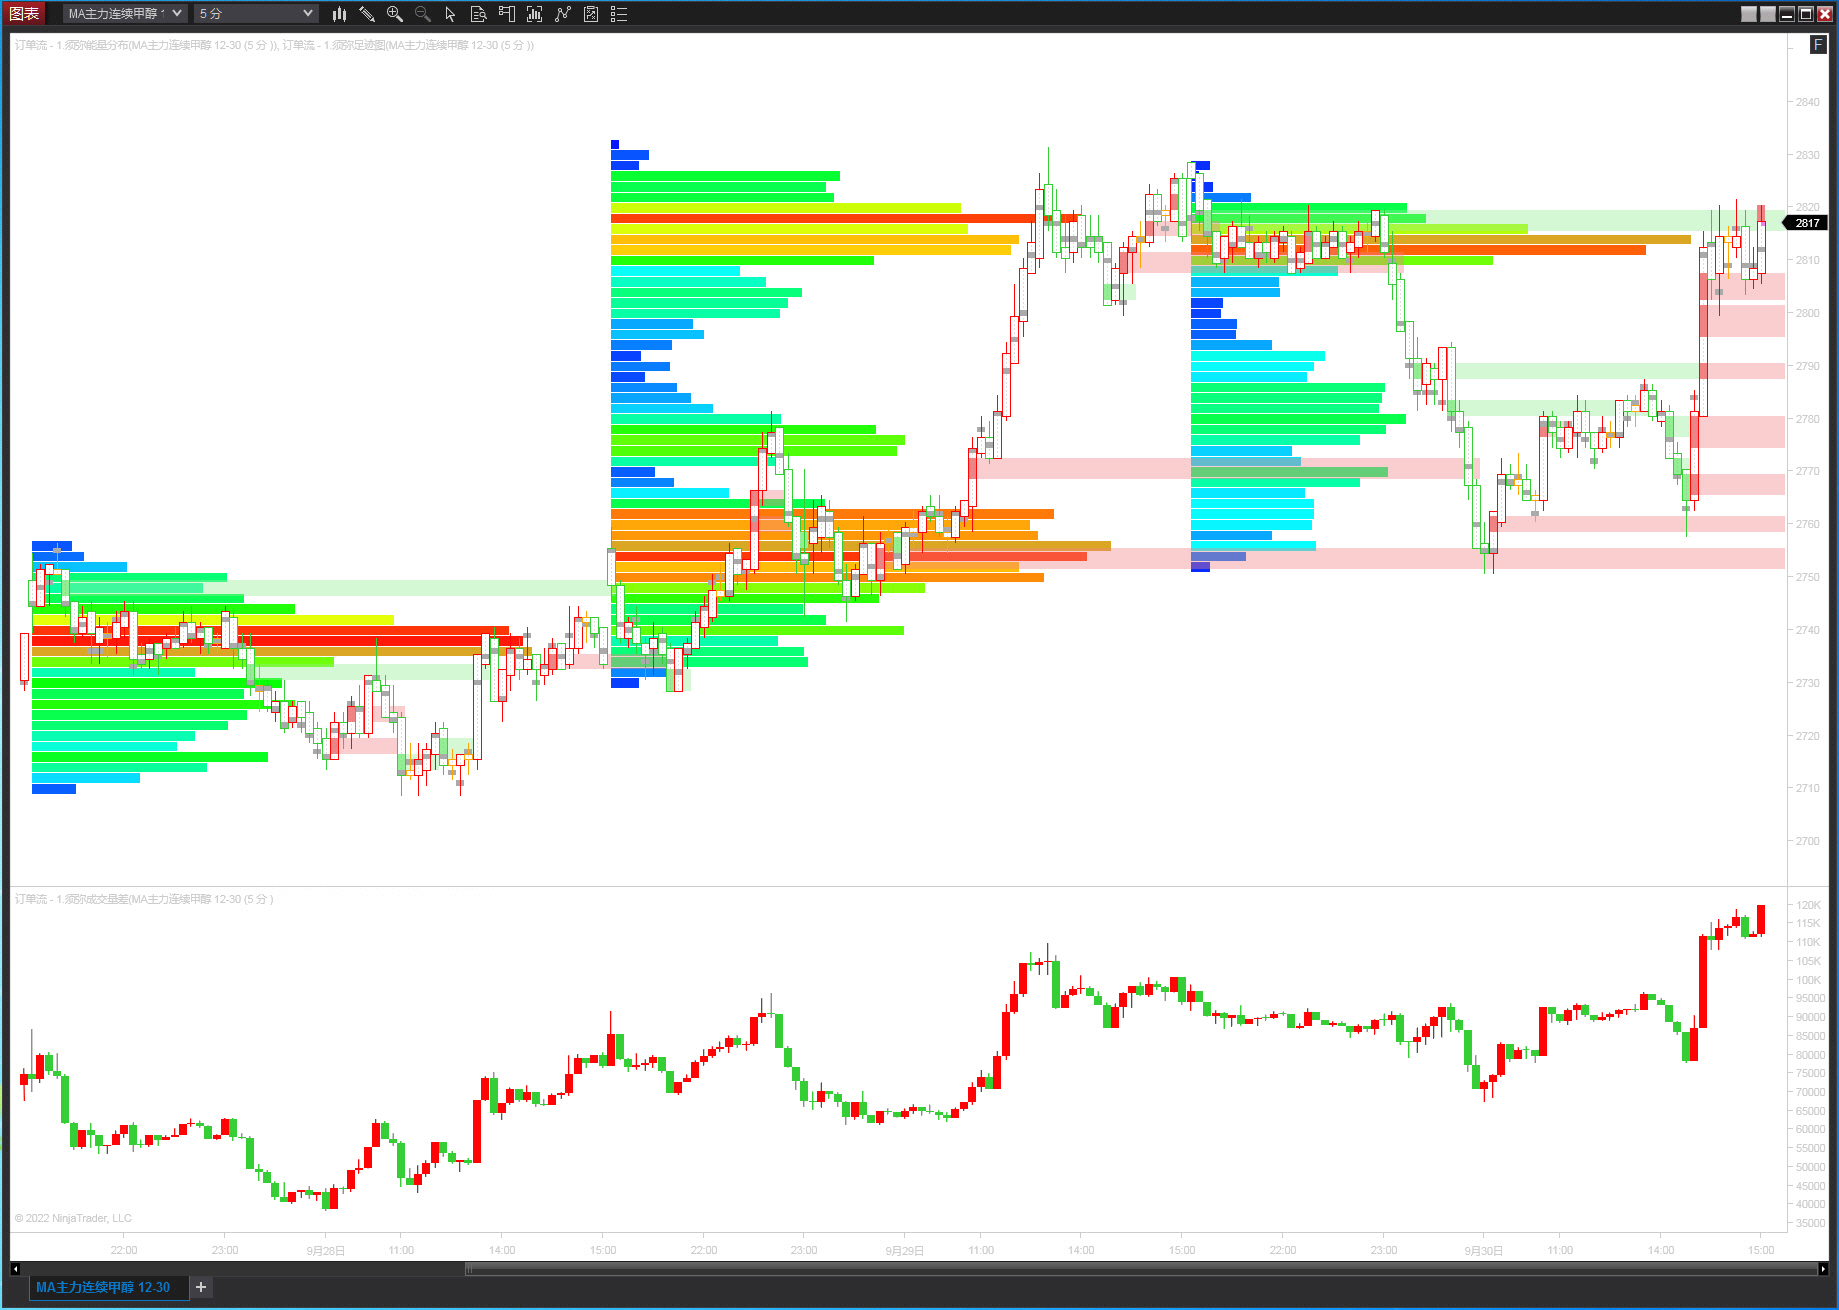 Xumi Volume Delta | 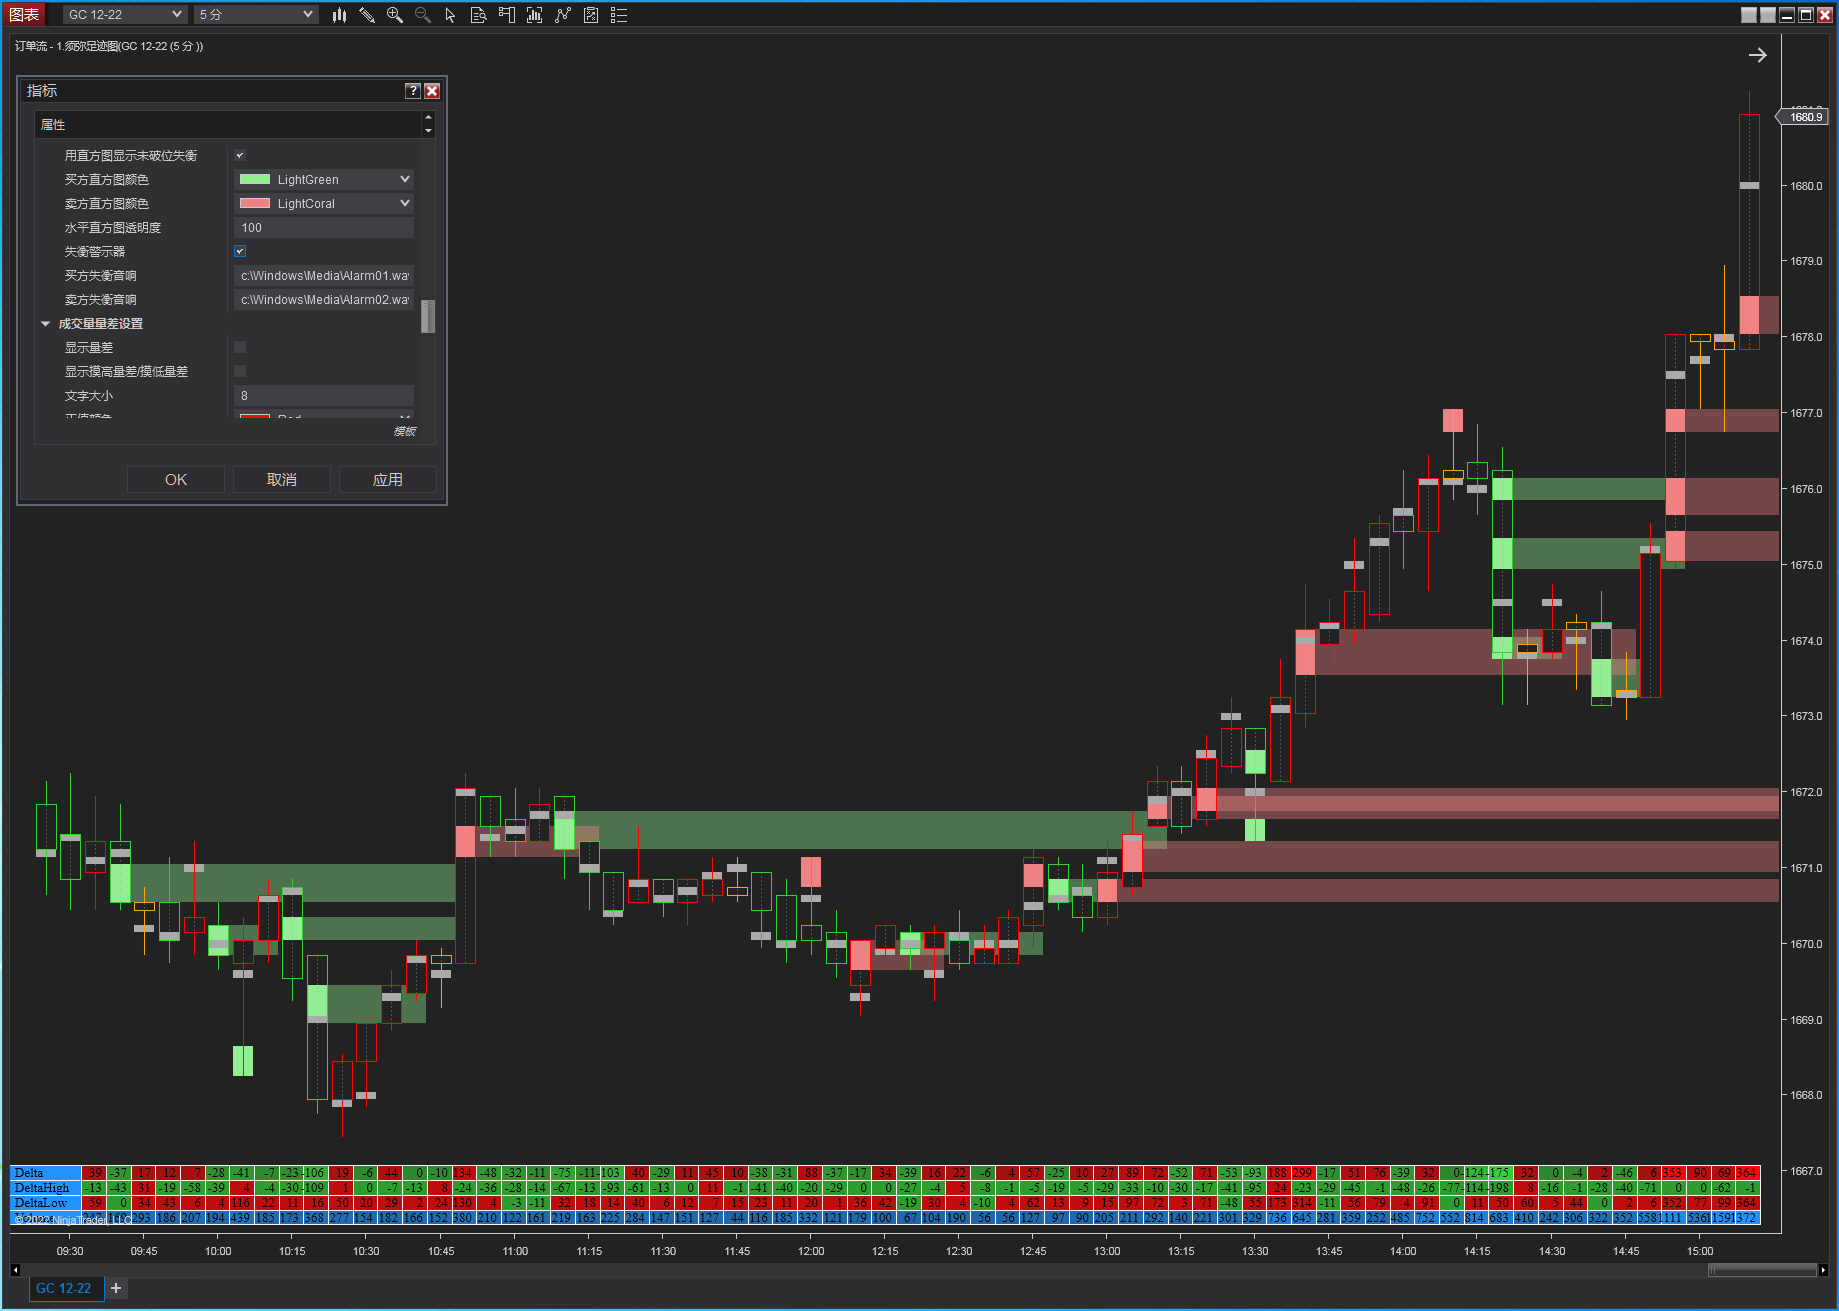 Xumi Imbalance Alert |
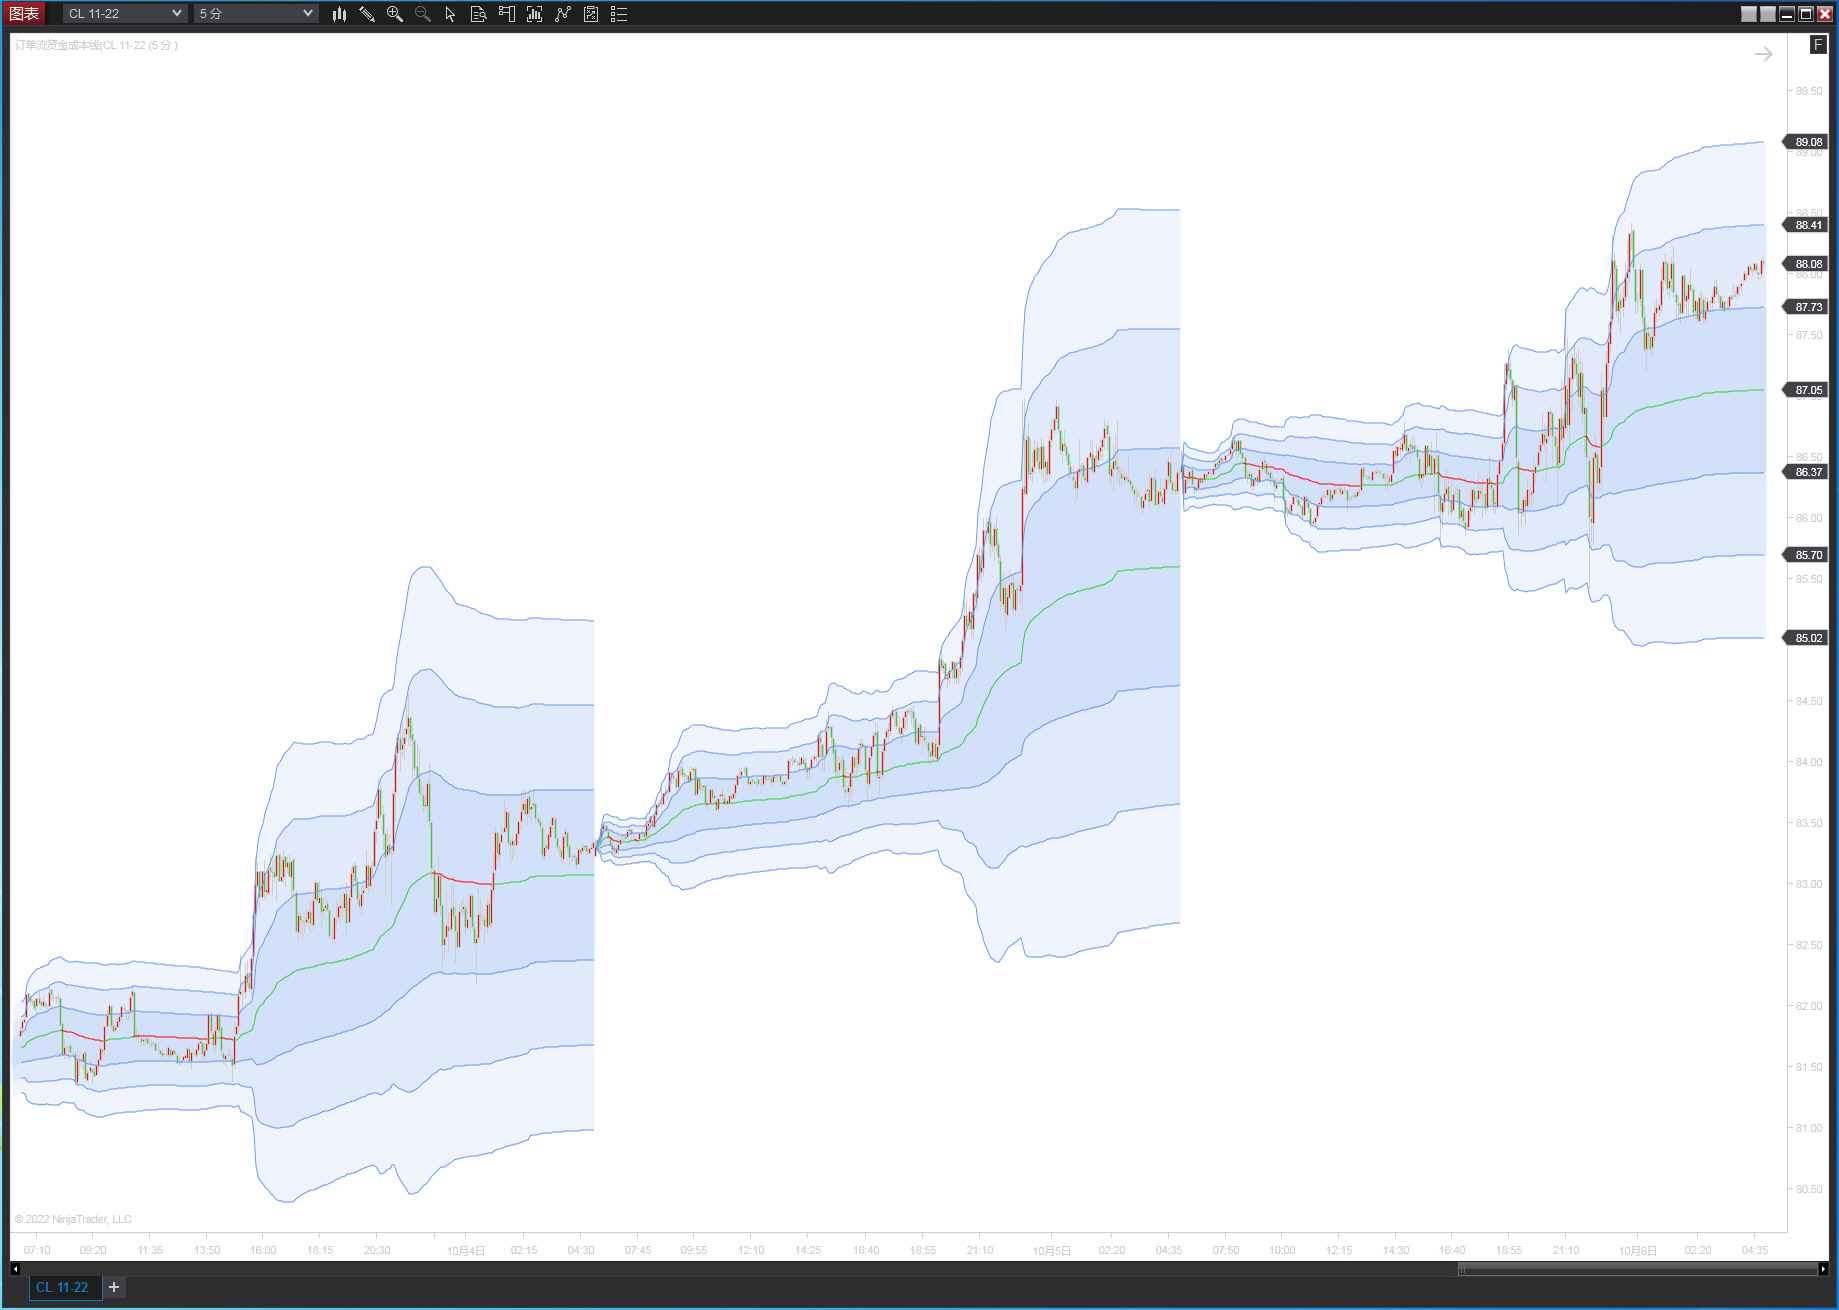 Capital Cost Line | 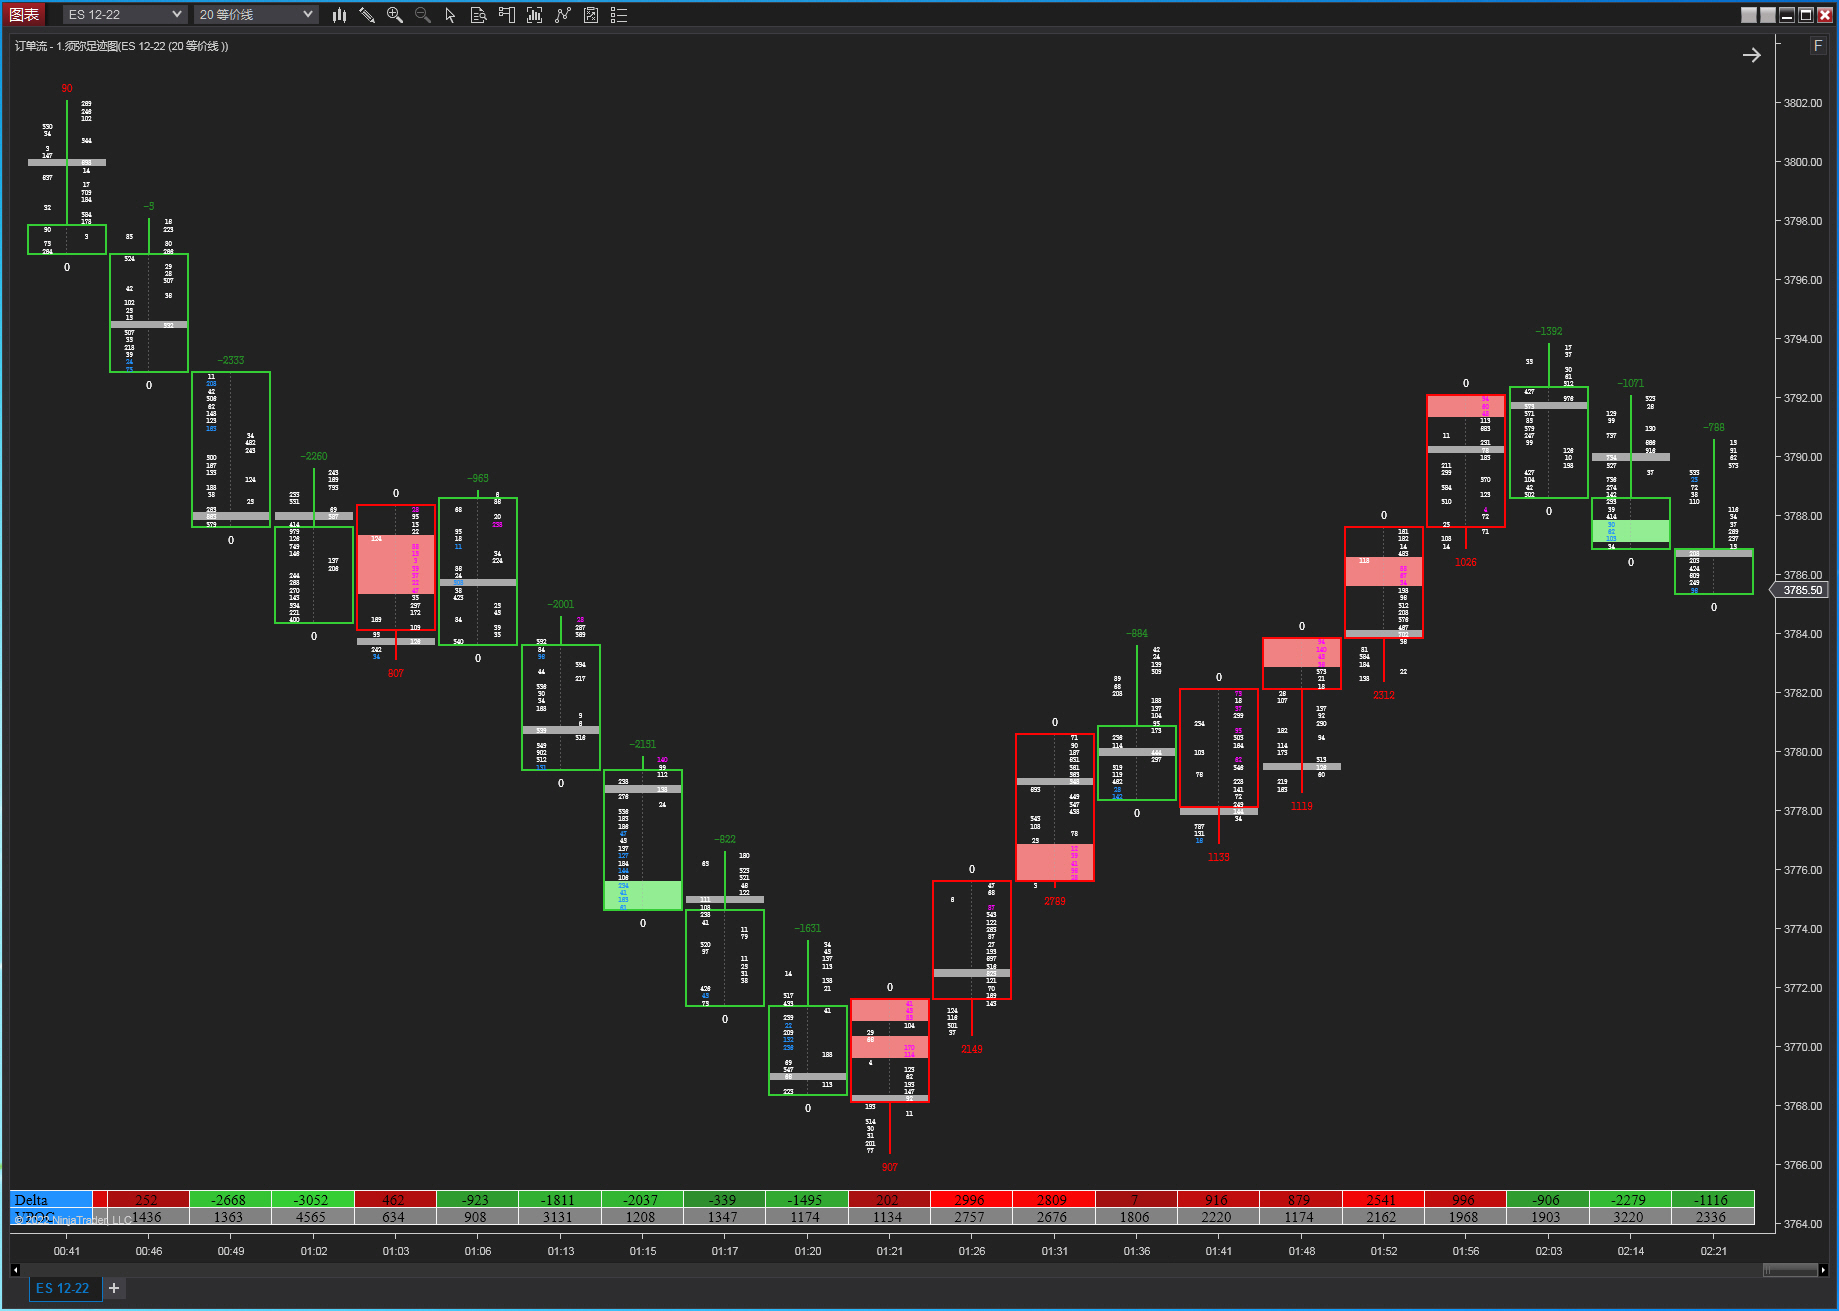 Net Buy Volume / Net Sell Volume | 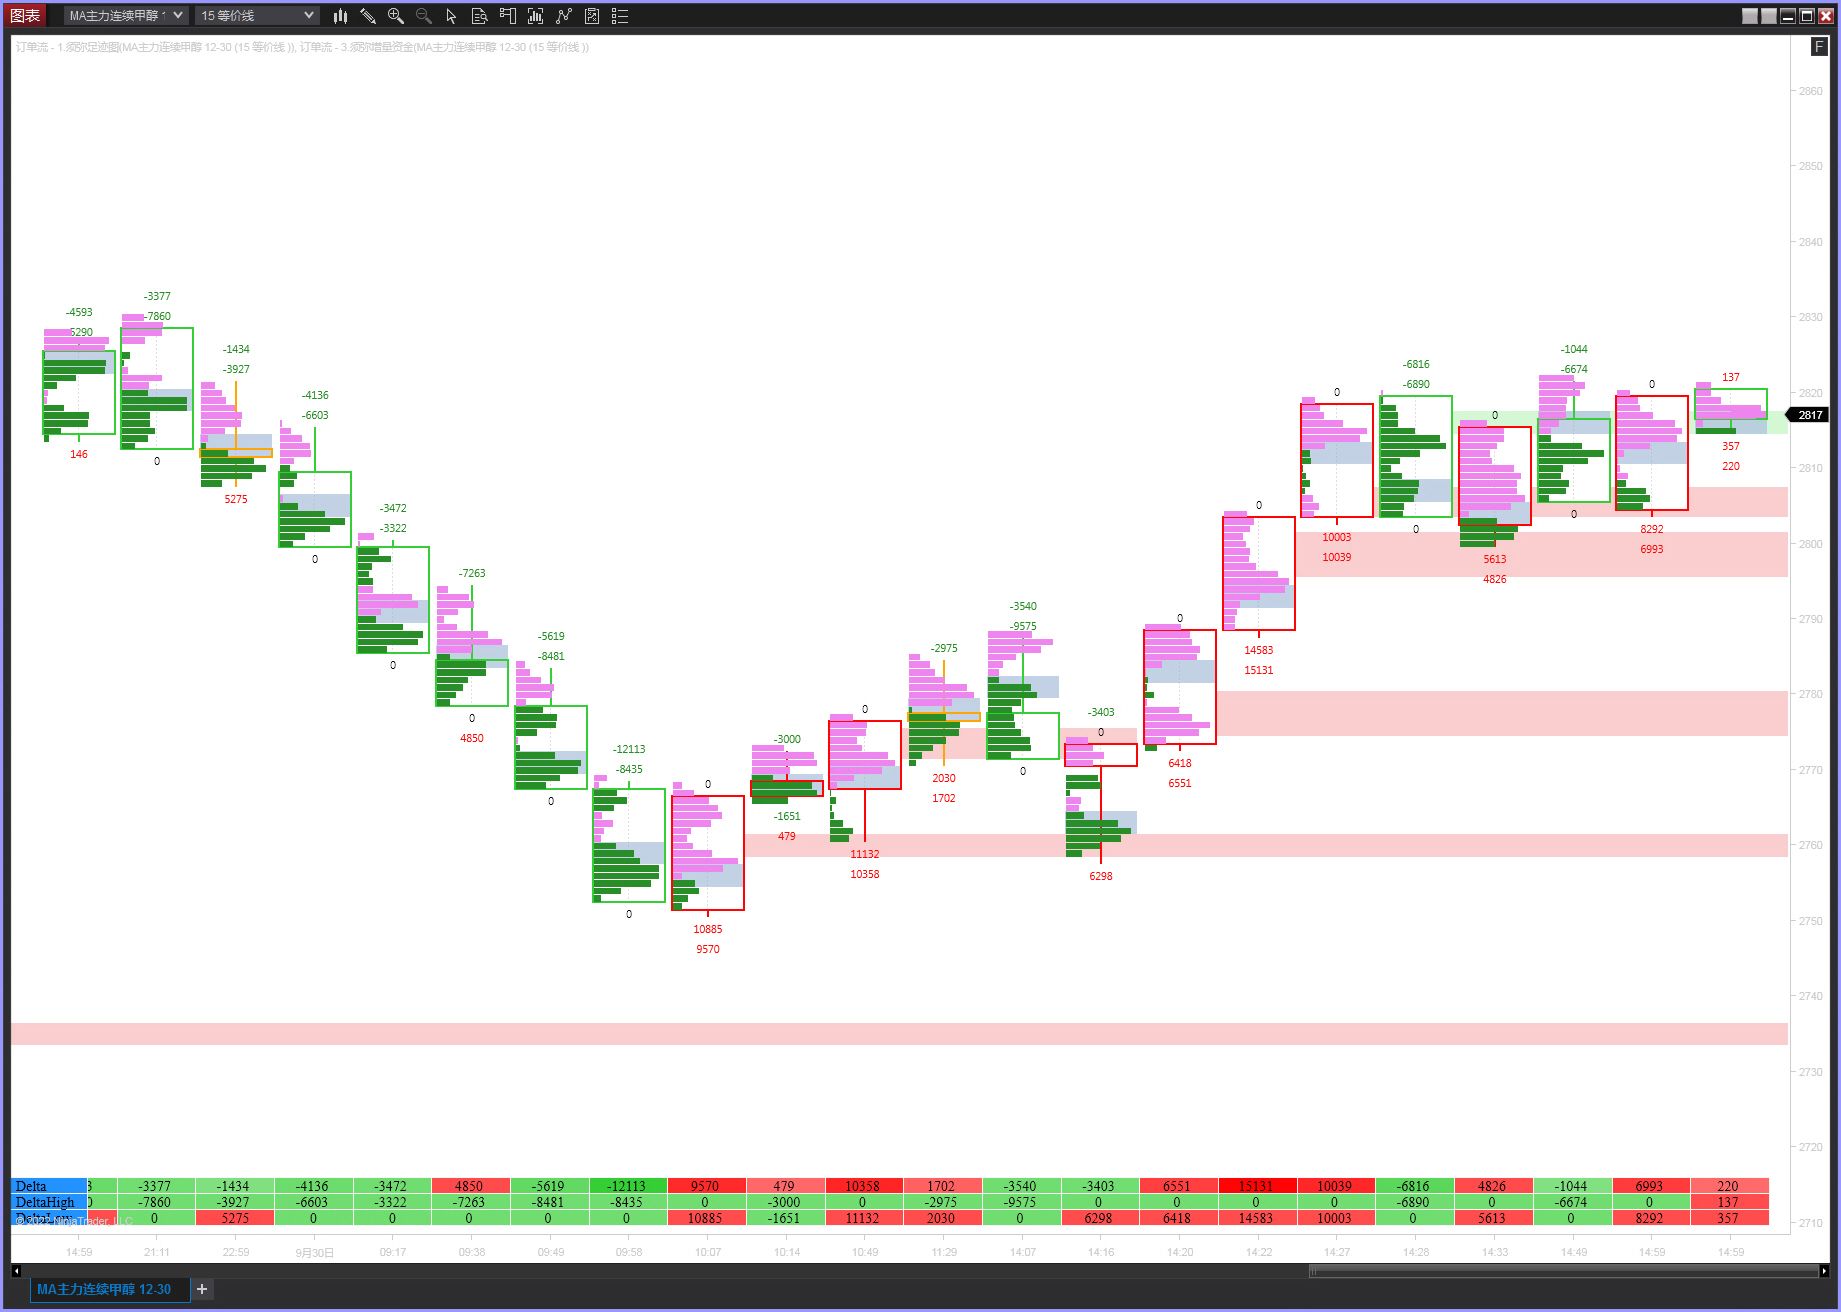 Incremental Capital Alert |
 Monitor Cell |  Xumi Energy Distribution | 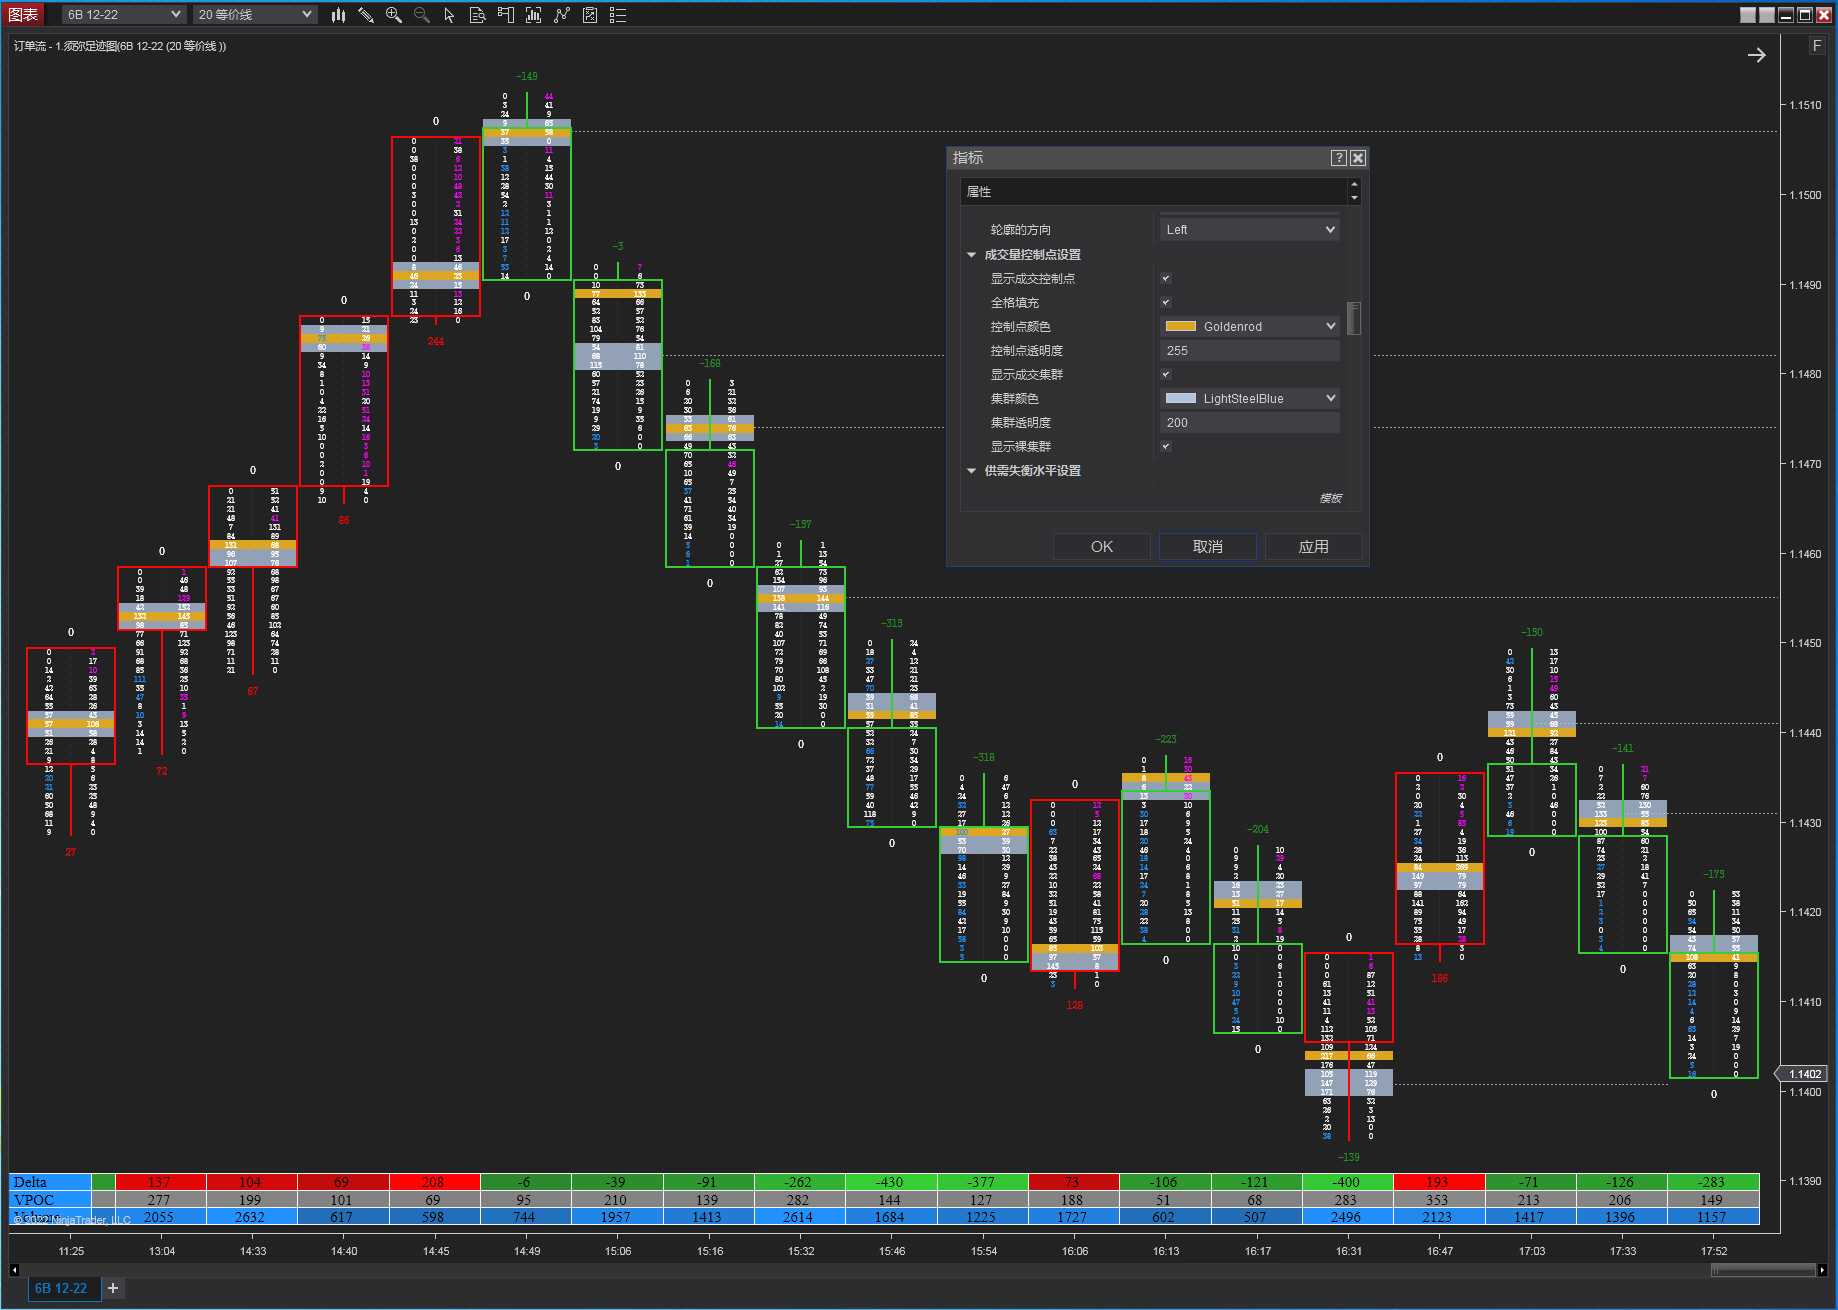 Highlight Trade Clusters |
 Multi-Window Workspace | 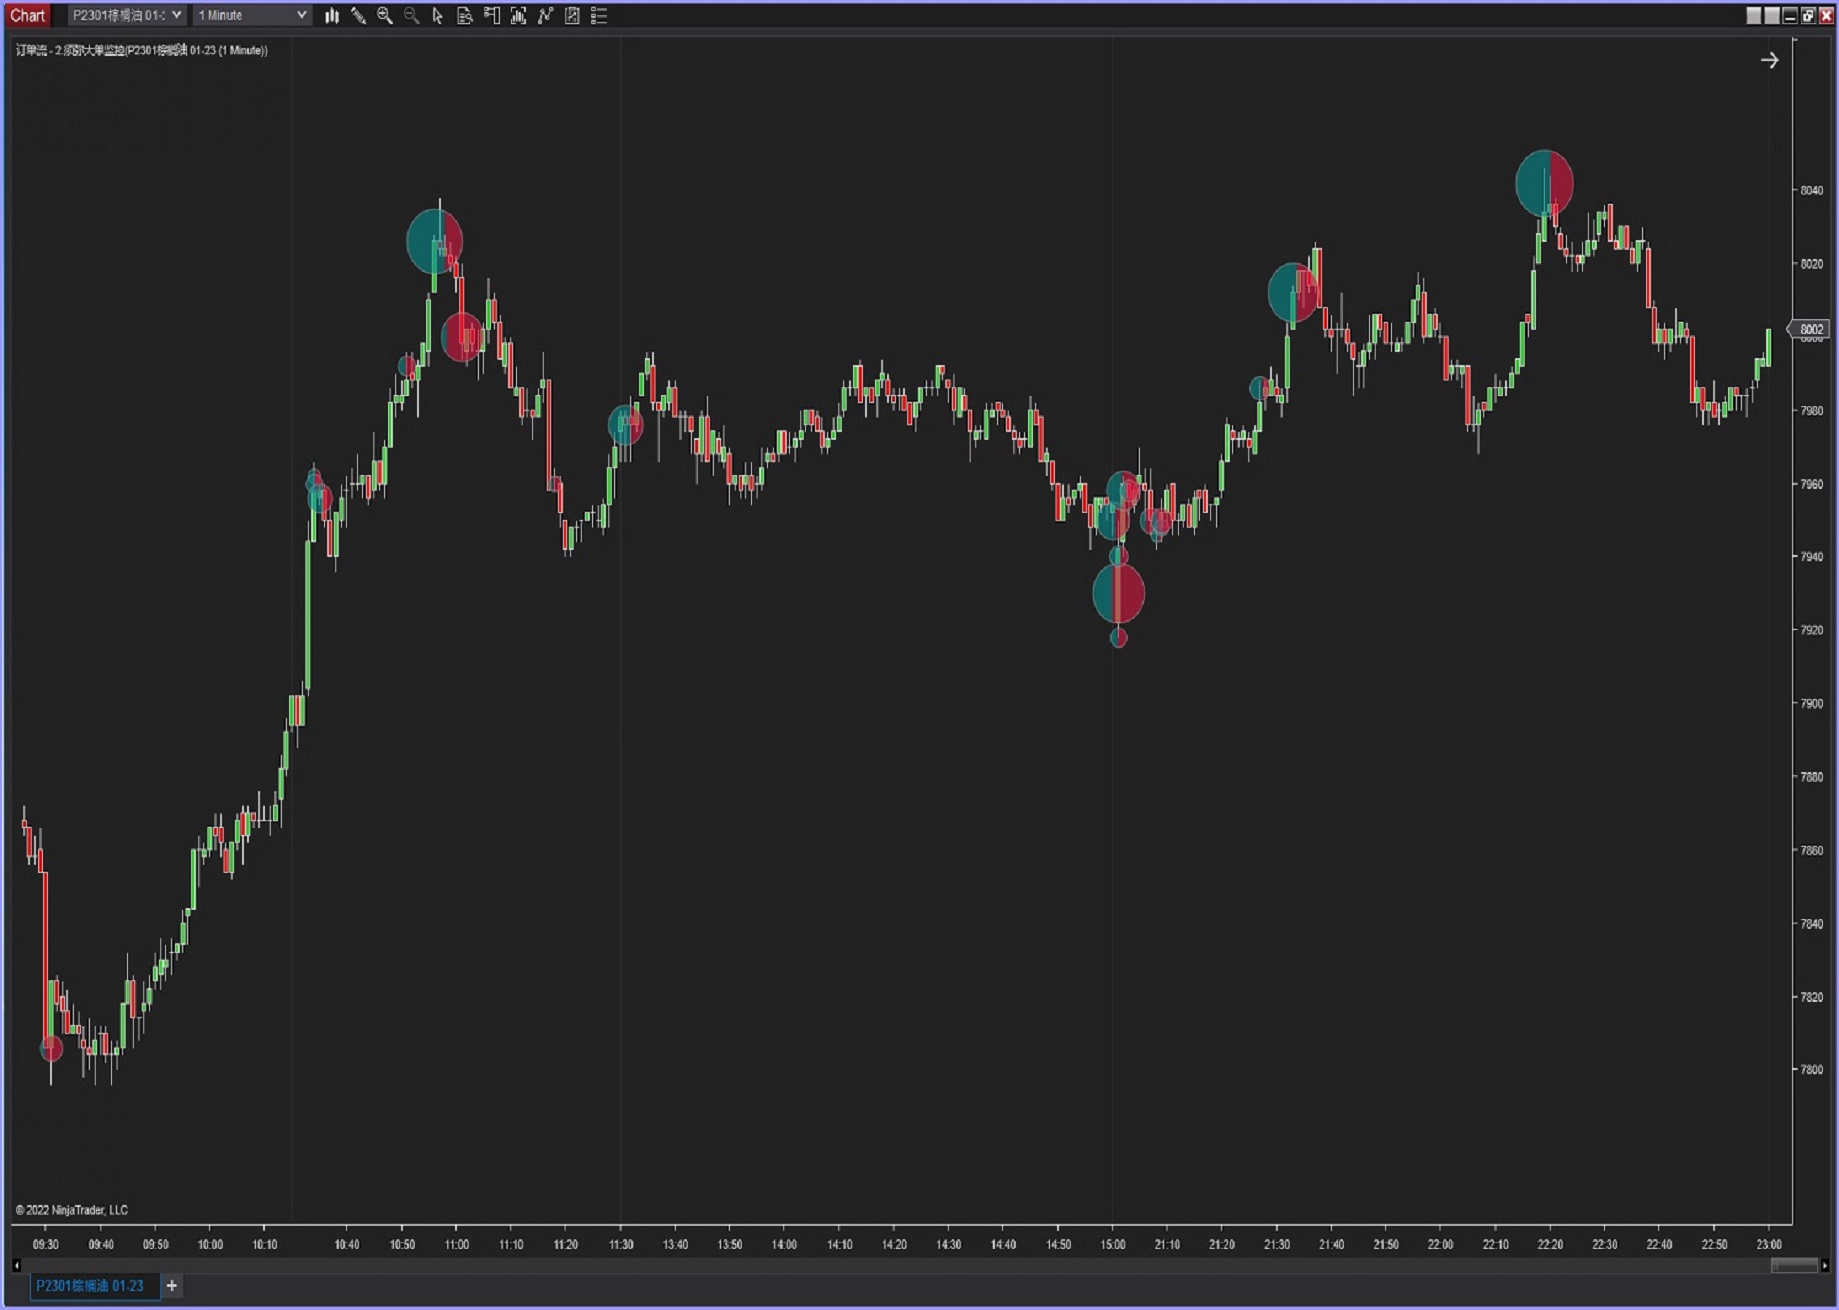 Large Order Detector | 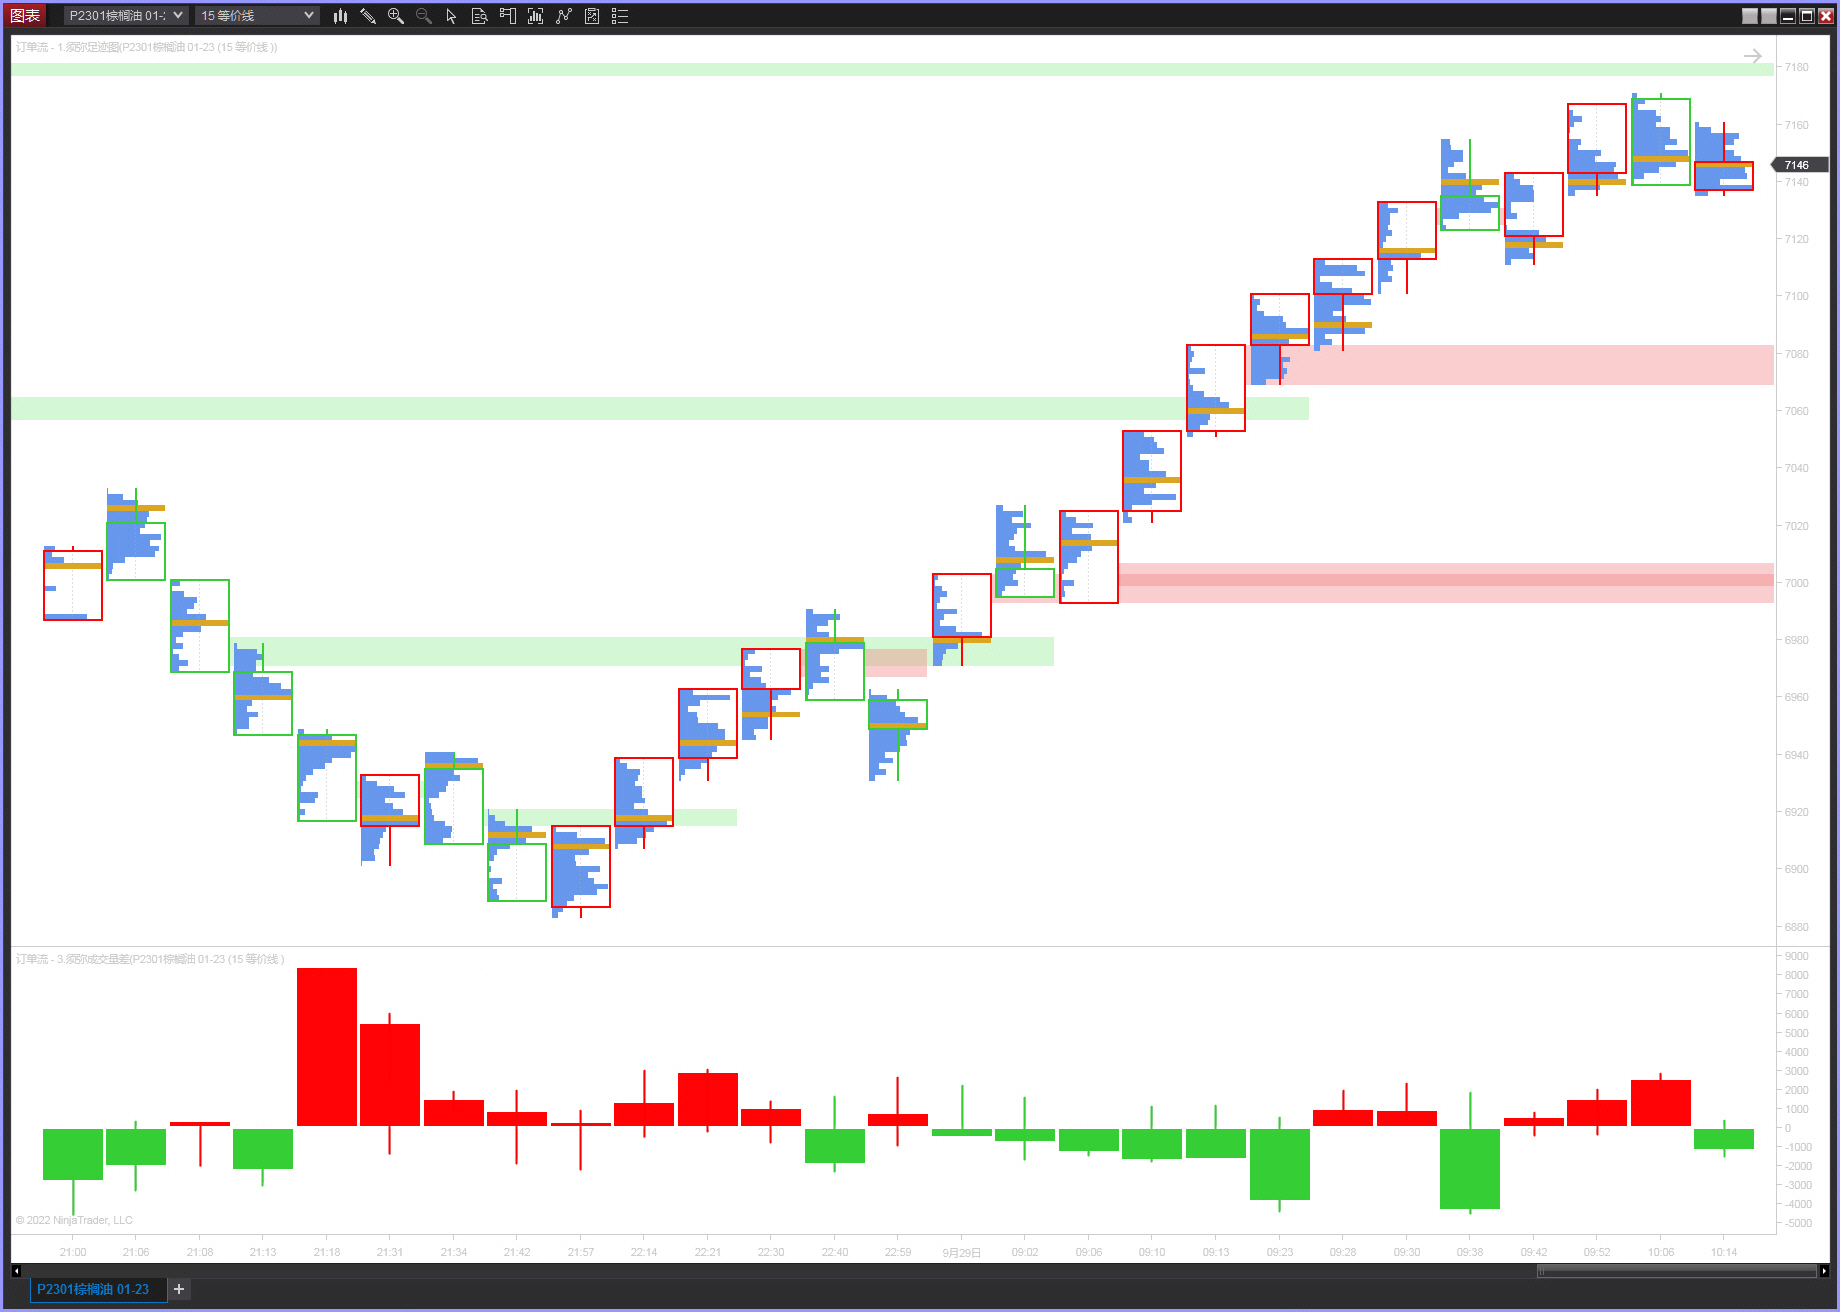 Total Capital Alert |
Great! How can I obtain these Order Flow indicators???

|

|

|
1. Practical Application of the Xumi Footprint Chart Market Decision System in Financial Markets
1.1 New Concept of the Xumi Footprint Chart Market Decision System
1.2 Basic Rules and Related Definitions of Xumi Footprint Chart
1.3 Common Issues and Precautions for Using Xumi Footprint Chart
1.4 Purchase, Installation, and Operation Process for Xumi Footprint Chart Indicators
1.5 Acquisition and Use of Xumi Order Flow Financial Futures Market Data
1.5.1 Example of Accessing Futures Market Data from the Chicago Mercantile Exchange (Free)
1.5.2 Example of Accessing Futures Market Data from China’s Four Major Futures Exchanges (Paid)
2. Overview of the Development Environment and Functional Uses of the Xumi Footprint Chart Market Decision System
2.1 Development Language Environment of the Xumi Footprint Chart Market Decision System
2.2 Computer Configuration Requirements for the Xumi Footprint Chart Market Decision System
2.3 Functional Overview of the Xumi Footprint Chart Market Decision System
2.4 Uses of the Xumi Footprint Chart Market Decision System
3. Indicator Module Description and Operation Guide for the Xumi Footprint Chart Market Decision System
3.1 Overview and Operation Instructions for the Xumi Order Flow Footprint Chart Indicator (Unlimited Version Only)
3.2 Overview and Operation Instructions for the Xumi Volume Profile Indicator (Unlimited Version Only)
I. Practical Application of the Xumi Order Flow Footprint Chart Decision System in Financial Markets
1.1 New Concepts of the Order Flow Footprint Chart Trading System
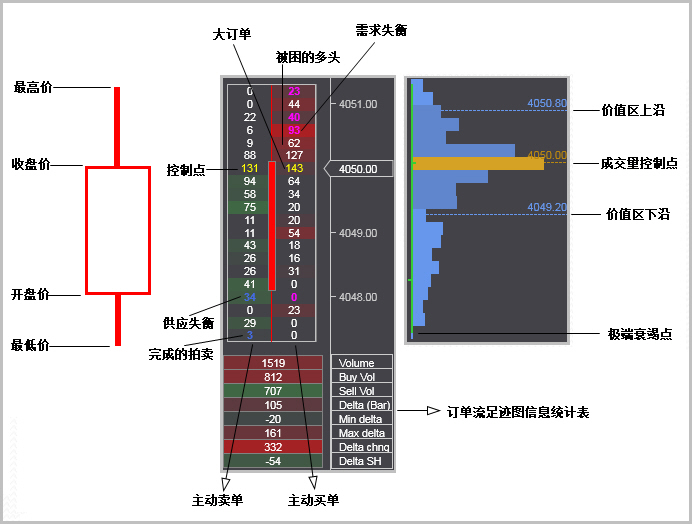
The “Order Flow Footprint Chart” marks each executed order at every price level within a candlestick chart, recording how orders enter the market, how they are executed on the bid and ask sides, and studies the relationship between market supply and demand forces from the most microscopic level through financial market price ascending auctions and price descending auctions. The invention of the “Footprint Chart” represents a major revolution in how “trade details” present market quote depth information.
The basic logic of the “Footprint Chart” is simple: when large traders want to buy or sell in the market, the process of executing their trades always leaves “traces,” which are displayed at each horizontal price level of the candlestick chart through executed orders and price movements.
The “Order Flow Footprint Chart” is an invention of Market DeltaTM. Trevor Harnett created the Footprint Chart in 2002, with the original concept being to “preserve executed market trading orders and make these orders visible on the chart.”
Little did we expect that over the past two decades, the “Footprint Chart” has become increasingly popular among traders worldwide, yet it has also faced controversy, been frequently misunderstood, and even distorted and misrepresented by certain so-called professional development and training institutions. It was only after meeting and communicating with Trevor himself that, over the years, Trevor personally taught us many trading methods related to the “Footprint Chart.” This unique technique has always been the most powerful practical analysis tool in our trading.
感谢特雷弗·哈内特对“须弥足迹图”软件开发的友情支持,本使用操作说明详细描述了《须弥足迹图行情决策系统》的基本规则和定义、常见问题和注意事项、足迹图交易系统指标开发、系统构建、金融行情数据连接、系统运行环境、须弥足迹图各项功能模块详细说明以及操作指南。凭借十余年在软件开发领域和实盘交易中的宝贵经验,我们将为交易者提供全系列订单流交易决策实用工具,帮助交易者切实接近和正确使用订单流足迹图,立足金融市场交易。
1.2 Basic Rules and Related Definitions of the Xumi Footprint Chart Trading Decision System
Institutions use blind spots to deceive us in our traditional indicators, preventing us from profiting, yet we are powerless. Although this is highly unfair, what can we do? This is a 100% legal industry.
Why does this happen? Because the tentacles of these institutions are entwined in every contract we buy or sell, moving right before our eyes, yet we turn a blind eye. It is this massive institutional order flow that drives the price fluctuations in the futures market.
Are you still waiting for candles to turn red or green before trading?
Are you still trading using support and resistance levels?
Are you still trading using chart pattern setups?
Are you still trading using wave theory?
It’s time!!! Add order flow to our trading system to help us make decisions, instead of working against it.
If we don’t learn how to use order flow now, how will we gain a real-time trading advantage? It’s hard to imagine how we can better determine entries and exits.
Without effective, real-time visualization tools to read and review order flow data, it’s hard to imagine how we will achieve trading profits.
It truly is time!!! We need to thoroughly understand the rules and definitions related to order flow trading.
1. Tick (Minimum Price Movement)
2. Bid (Bid Price)
3. Ask (Ask Price)
4. Aggressive Buy
5. Aggressive Sell
6. Passive Buy
7. Passive Sell
8. Large Order
9.DOM (Market Depth) (DOM)
10. Order Book (Buy and Sell) (Buy and Sell)
11. FootPrint Chart
12. Order Flow
13. Limit Order
14. Market Order
15. Stop Order
16. Point of Control (POC)
17. Trade Cluster
18. Bid Imbalance
19. Ask Imbalance
20. Delta Imbalance
21. Market Liquidity
22. Market Volatility
23. Delta
24. Maximum Delta
25. Minimum Delta
26. Delta Divergence
27. Volume Profile (VP)
28. High Volume Area (Peak)
29. Low Volume Area (Valley)
30. Trapped Longs
31. Trapped Shorts
32. Confirmation and Non-Confirmation
33. Rejection and Acceptance
34. Balance Zone
35. Exhaustion
36. Absorption
37. Net Buy Volume and Net Sell Volume
1.3 Common Questions and Precautions for the Xumi Footprint Order Flow Trading Decision System
1.3.1 Common Questions about Xumi Footprint Charts
1.What is the relationship between the order data source of Xumi Footprint Charts and Market Depth (DOM)?
2.For which type and time frame of charts are Xumi Footprint Charts most effective?
3.Do the order numbers in the left and right columns of Xumi Footprint Charts represent real market sell and buy orders?
4.Can Xumi Footprint Charts be used for all market instruments globally?
5.What advantages does the Xumi Footprint Chart have compared to traditional technical indicator analysis methods?
1.3.2 Precautions for Using Xumi Footprint Charts
1.The extreme importance of control points, imbalances, and delta in applying footprint charts to live trading.
2.Effort vs. result, and absorption vs. initiative are consistent principles for understanding orders and market behavior.
3.The exchange between net buy volume and net sell volume is the reason driving rapid market rises and falls.
4.Combine the Xumi Energy Distribution Equivalence Chart with the Xumi Footprint Time Chart to identify market structure.
5.The Xumi Footprint Chart must be used correctly in conjunction with the trading system within key actionable zones.
1.4 Xumi Footprint Chart Purchase, Installation, and Operation Process
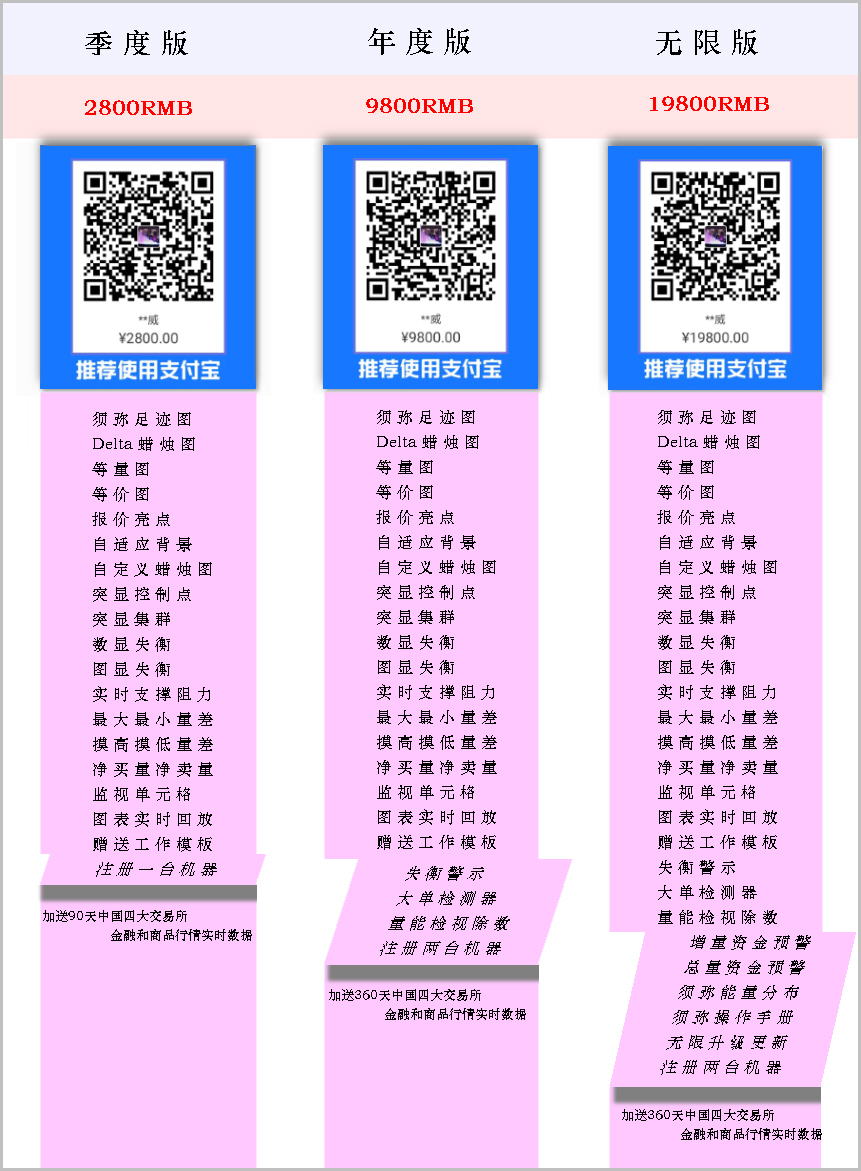
1.4.1 Purchase Order Flow–Xumi Footprint Chart Quarterly, Annual, and Lifetime Editions.

Official Website:http://www.xumiorderflow.com
1.4.2 We customize your Order Flow–Xumi Footprint Chart Exclusive Edition.
【Purchase Version Information】
【Alipay Purchase Receipt】
【Contact Email】
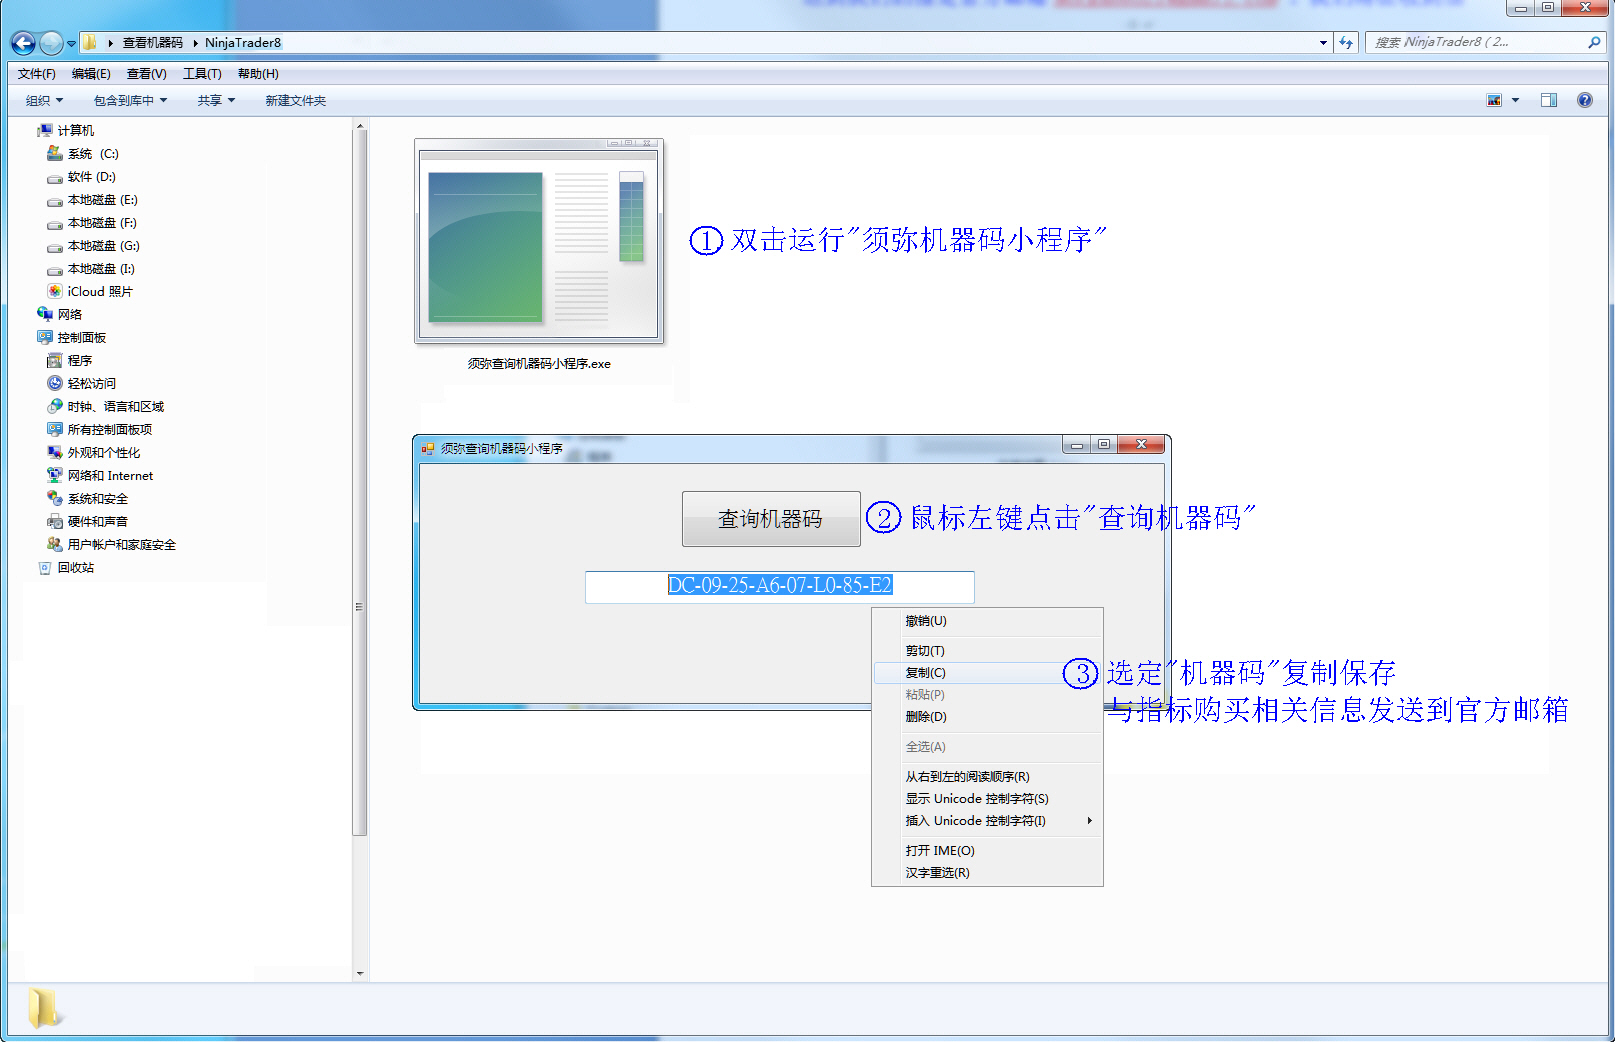
【Computer Machine Code】→【Machine Code Query Steps】 ① ② ③ 】
① Download the machine code query program via https://multicharts-package.com/download/Xumi_MachineID.exe
;② Directly run the “Xumi Machine Code Mini Program” and left-click “Query Machine Code”;
③ Copy the “Computer Machine Code” and send it together with the indicator purchase-related information to the official email;
Send the above information to our official email [email protected]
After we confirm the purchase information, a customized version will be sent to your [Contact Email] within 24 hours.
1.4.3 Please check your [Contact Email] for the Xumi Order Flow installation program. Before installing, be sure to close
NinjaTrader software first, then install the Xumi Order Flow program.
① Right-click the “ Xumi_Setup.exe ” icon, then left-click the “Open” option to run the Xumi Order Flow installation program;
② Or double-left-click the “ Xumi_Setup.exe ” icon to run the Xumi Order Flow installation program.

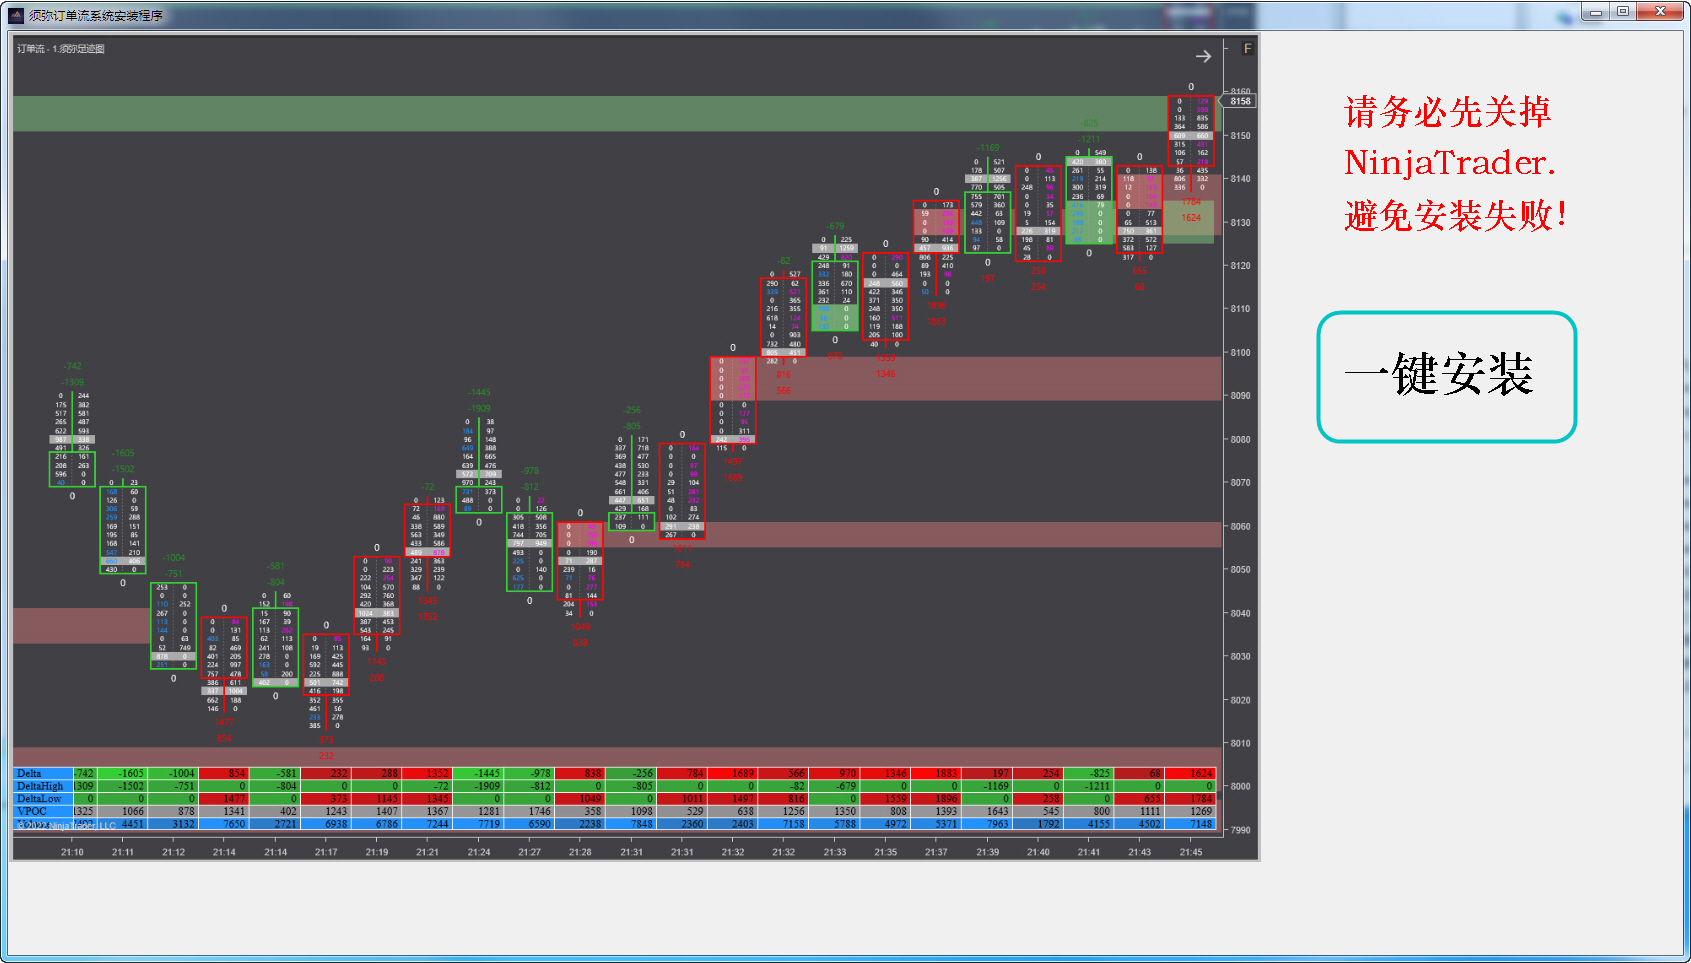
1.4.4 Left-click “One-Click Install”.
Note: Please ensure you close the NinjaTrader software first to avoid installation failure.
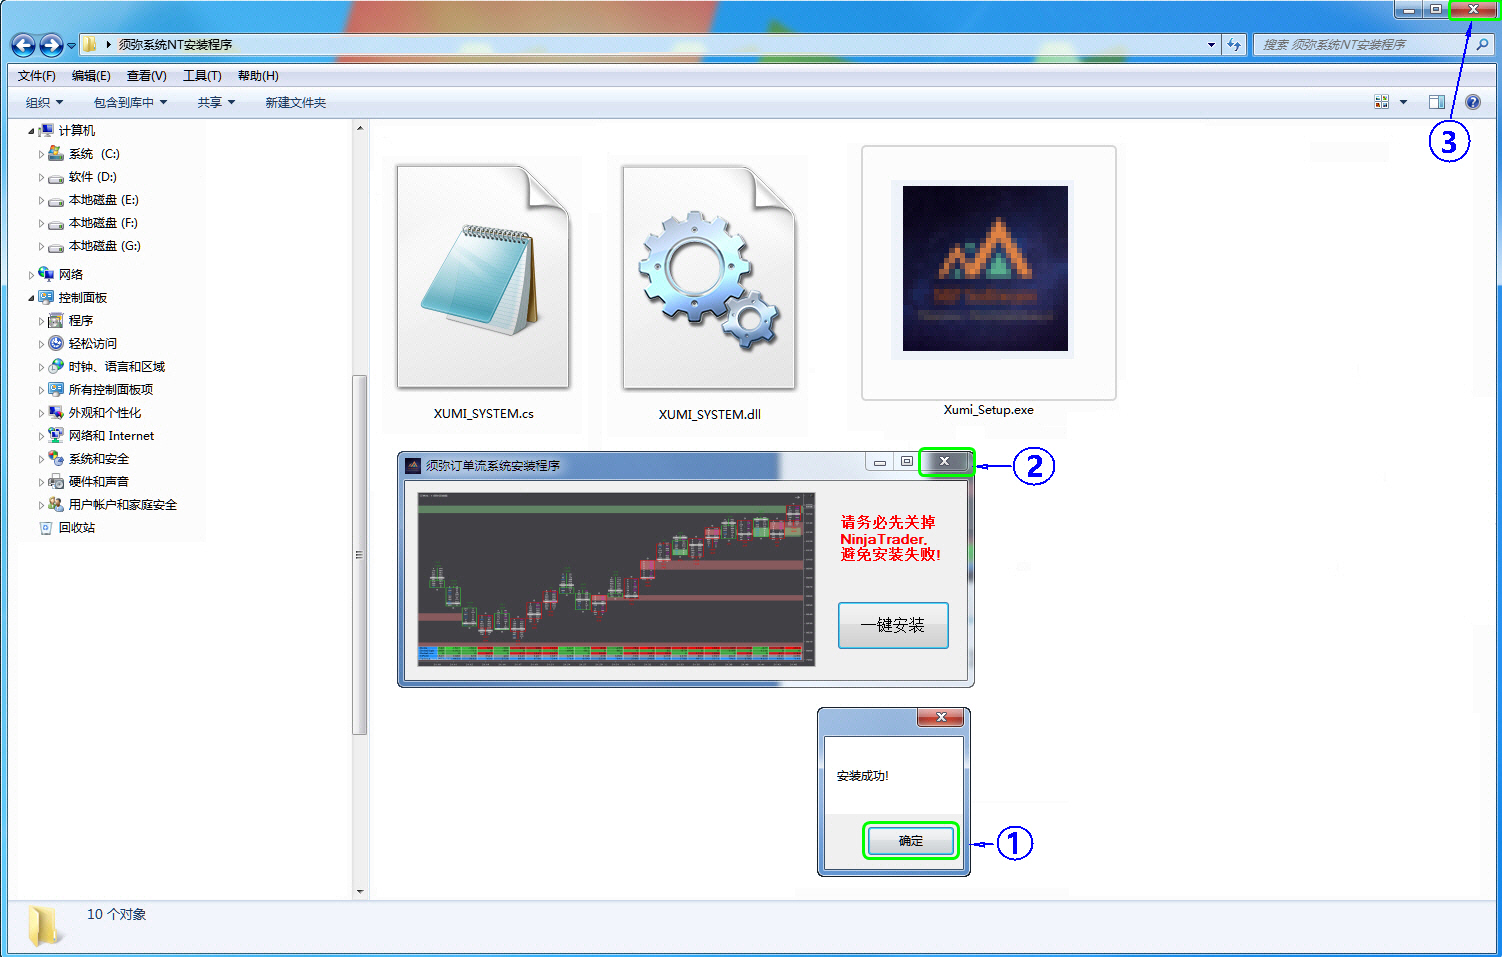
1.4.5 The message “Installation successful!” appears.
① Click “OK” to complete the installation;
② Click to close the “Xumi Order Flow System Installation Program” window;
③ Click to close the “Folder” window.
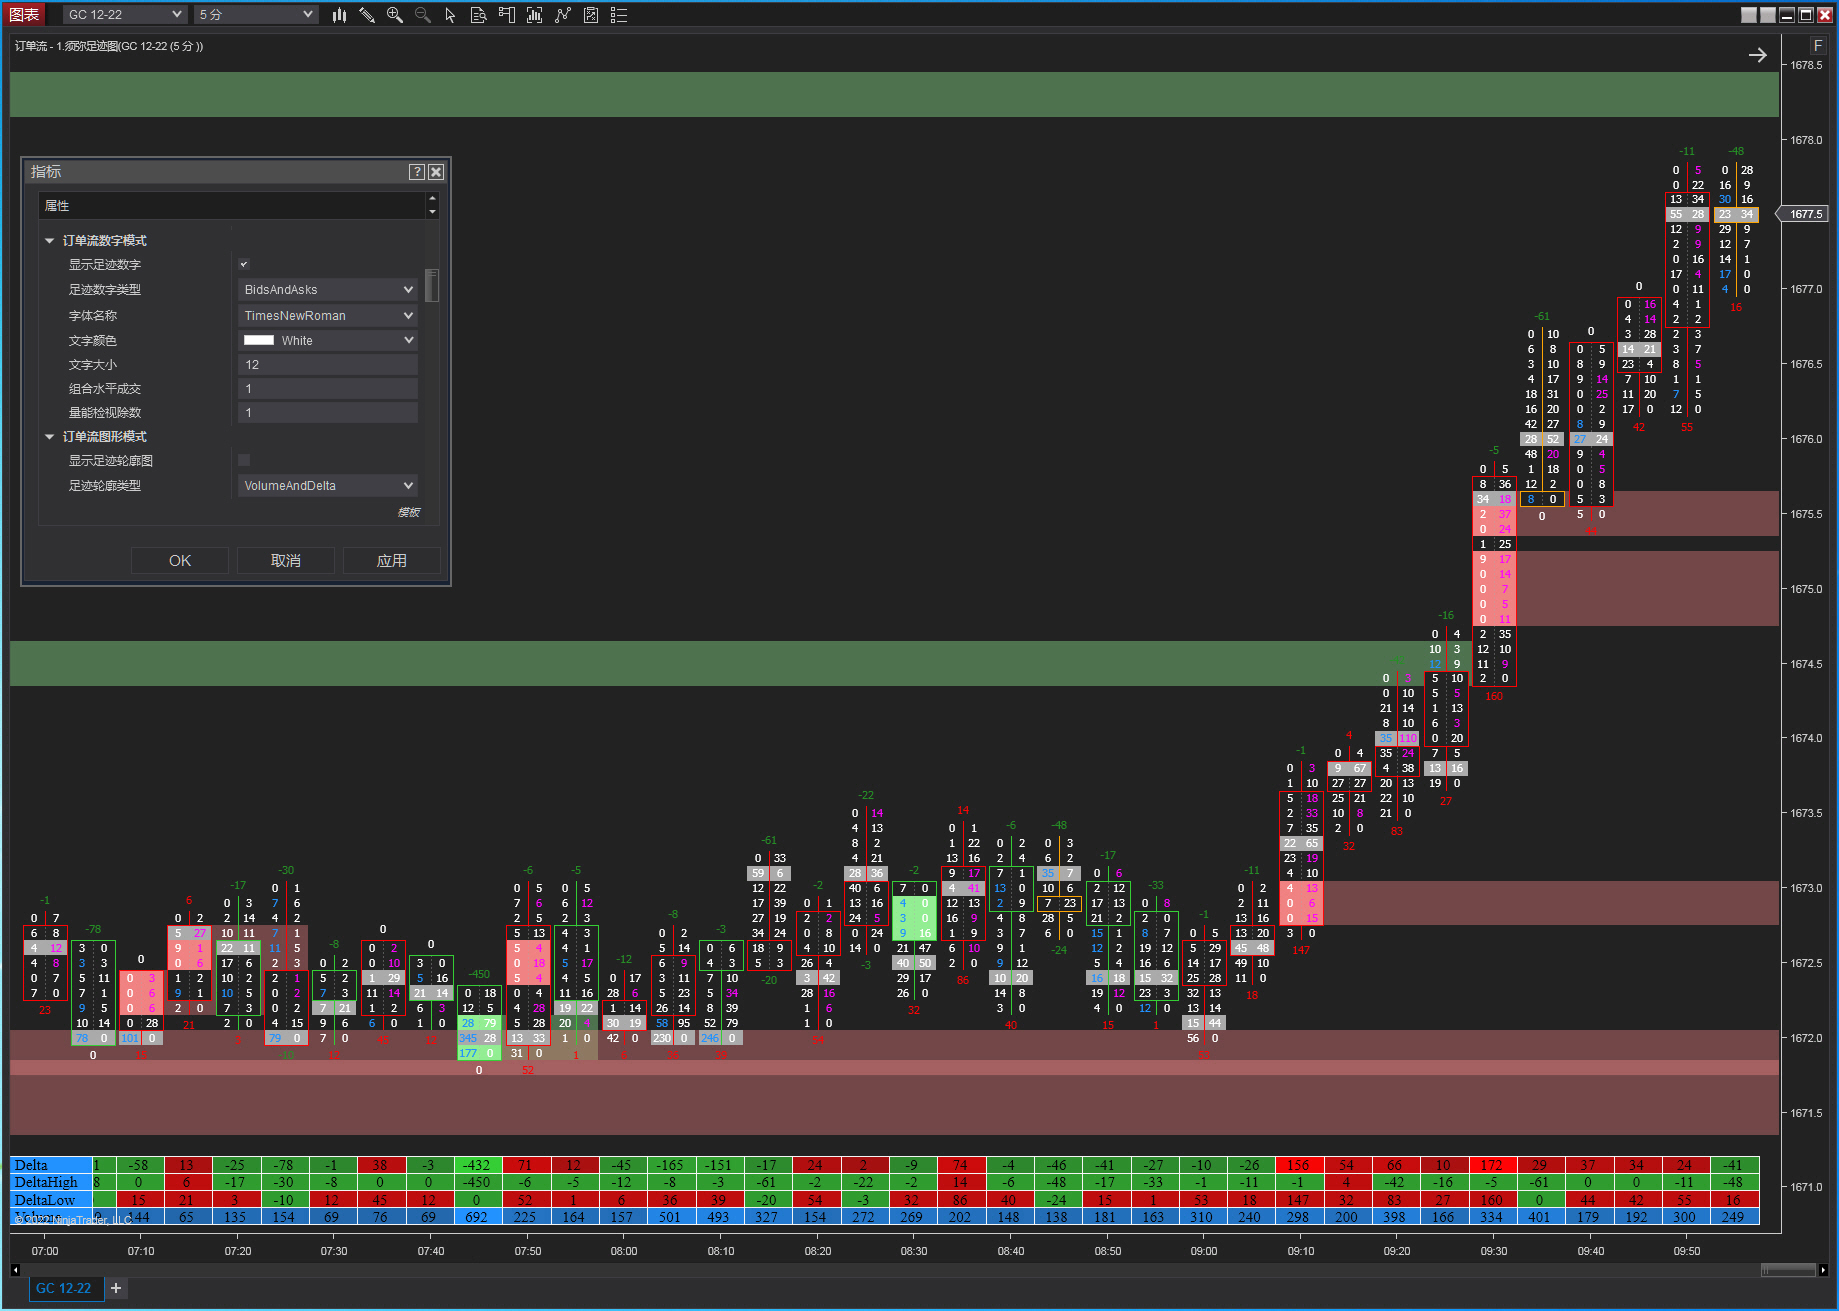
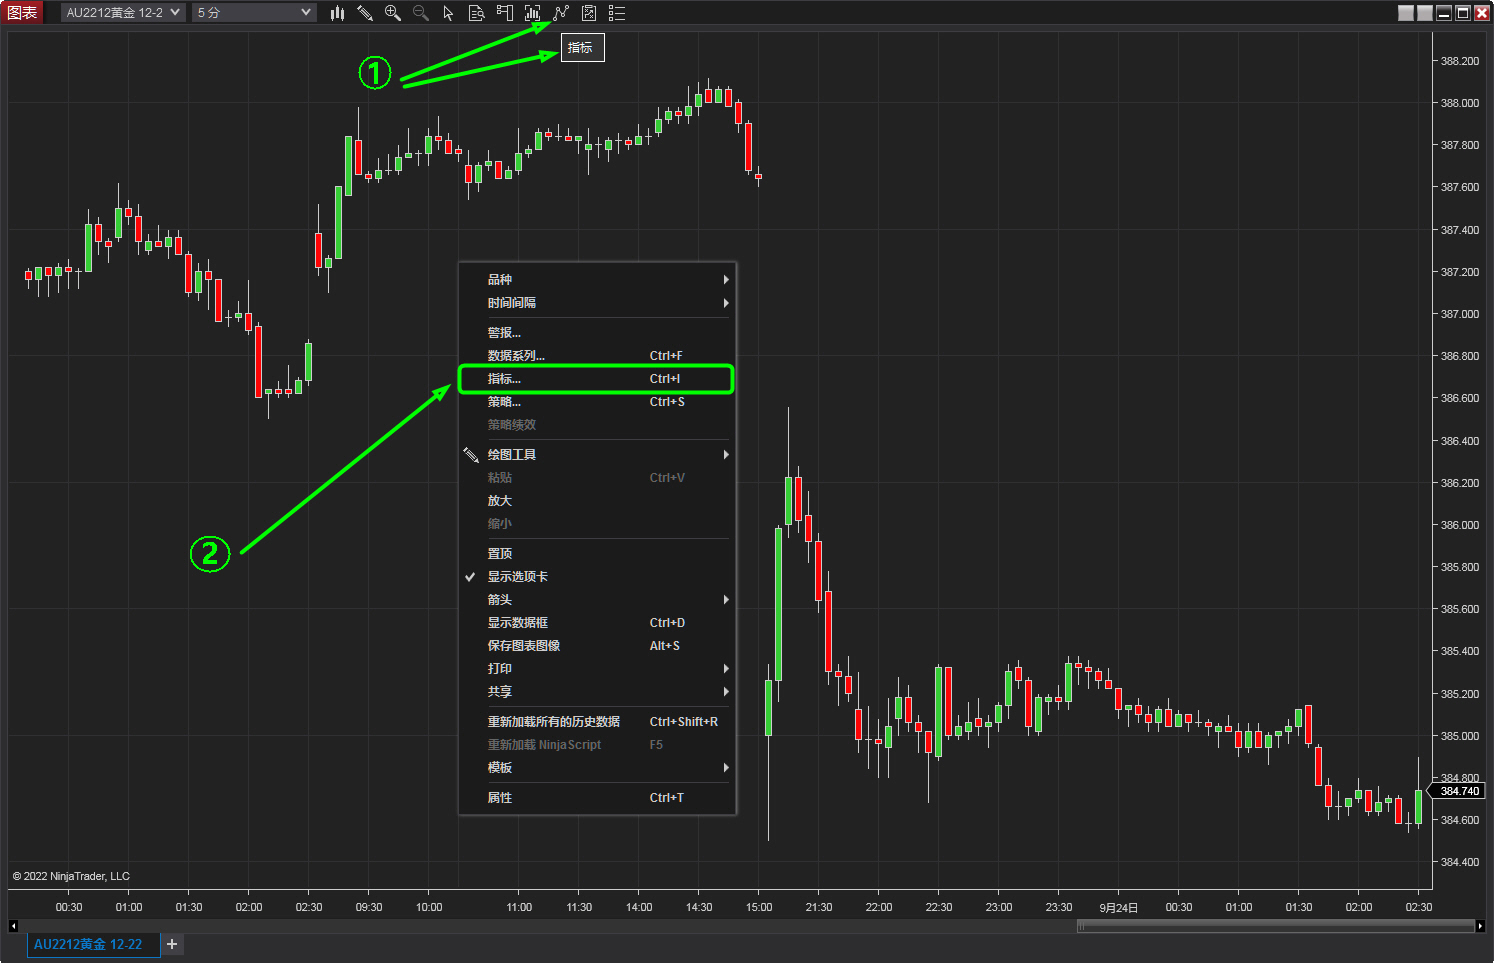
1.4.6 Call the “Order Flow-1.Xumi Footprint Chart” indicator.
① Left-click the “Indicator” icon in the chart window;
② Or right-click to open the window and select “Indicator”.
1.4.7 Call the “Order Flow-1.Xumi Footprint Chart” indicator (continued).
③ In the upper-left corner of the indicator window, under ‘Available’ indicators, locate the “Orderflow_Xumi” folder and double-click to expand “Order Flow-1.Xumi Footprint Chart”, then left-click to select it;
④ In the lower-left corner of the indicator window, under ‘Configuration’, left-click “Add”;
⑤ Finally, in the lower-right corner of the indicator window, left-click “Apply” or “OK” to complete the call of the “Order Flow-1.Xumi Footprint Chart” indicator.

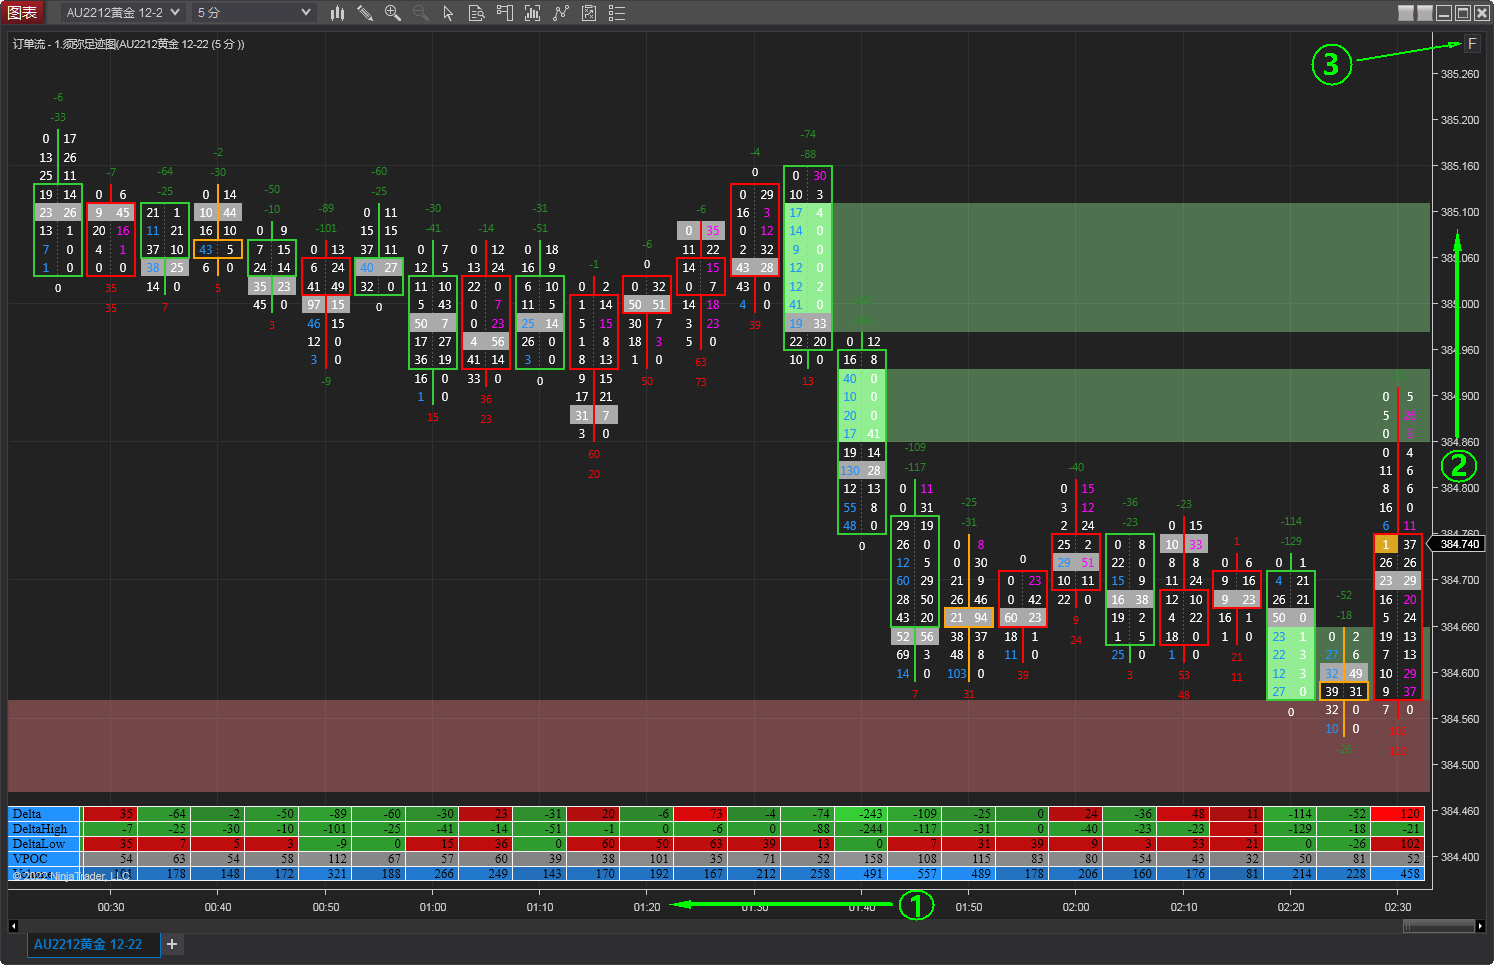
1.4.8 Adjust the display of the “Order Flow-1.Xumi Footprint Chart” main interface.
①In the “Chart” window, long-press the left mouse button on the time horizontal axis and drag it to the right;
②In the “Chart” window, long-press the left mouse button on the price vertical axis and drag it upward;
③ Left-click the “F” zoom button at the top of the “Chart” window. Repeat the steps until the Xumi Footprint chart is fully displayed.
1.5 Acquisition and use of Xumi Order Flow financial futures market data.
1.5.1 Example of accessing Chicago Mercantile Exchange (CME) futures market data (free).
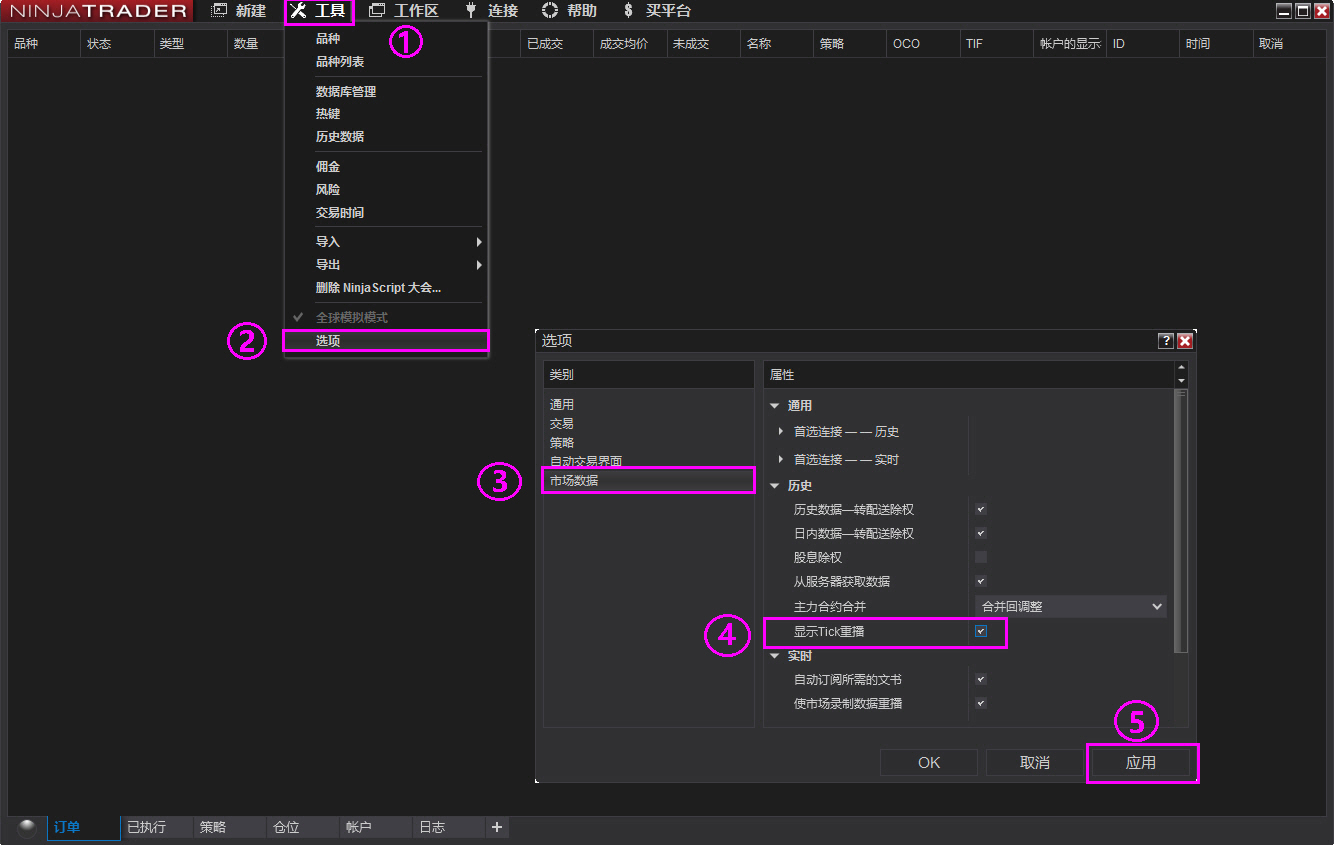
1. To use the “Order Flow Xumi Footprint” indicator in the Ninjatrader platform software, you must select Tick format financial futures market data.
① Open the Ninjatrader software and click the “Tools” dropdown menu;
② Select “Options”;
③ Select “Market Data”;
④ Check “Show Tick Replay”;
⑤ Click “Apply” to complete.
2. Register a free NetEase email account via https://www.163.com/ (used to apply for CME free futures market data source username and password on the NT software platform).
① Open the NetEase email registration page and customize the email name;
② Customize the email password;
③ Enter an 11-digit mobile number to receive the email registration verification code;
④ Check the agreement option, click “Register Now”, and the email registration is successful.

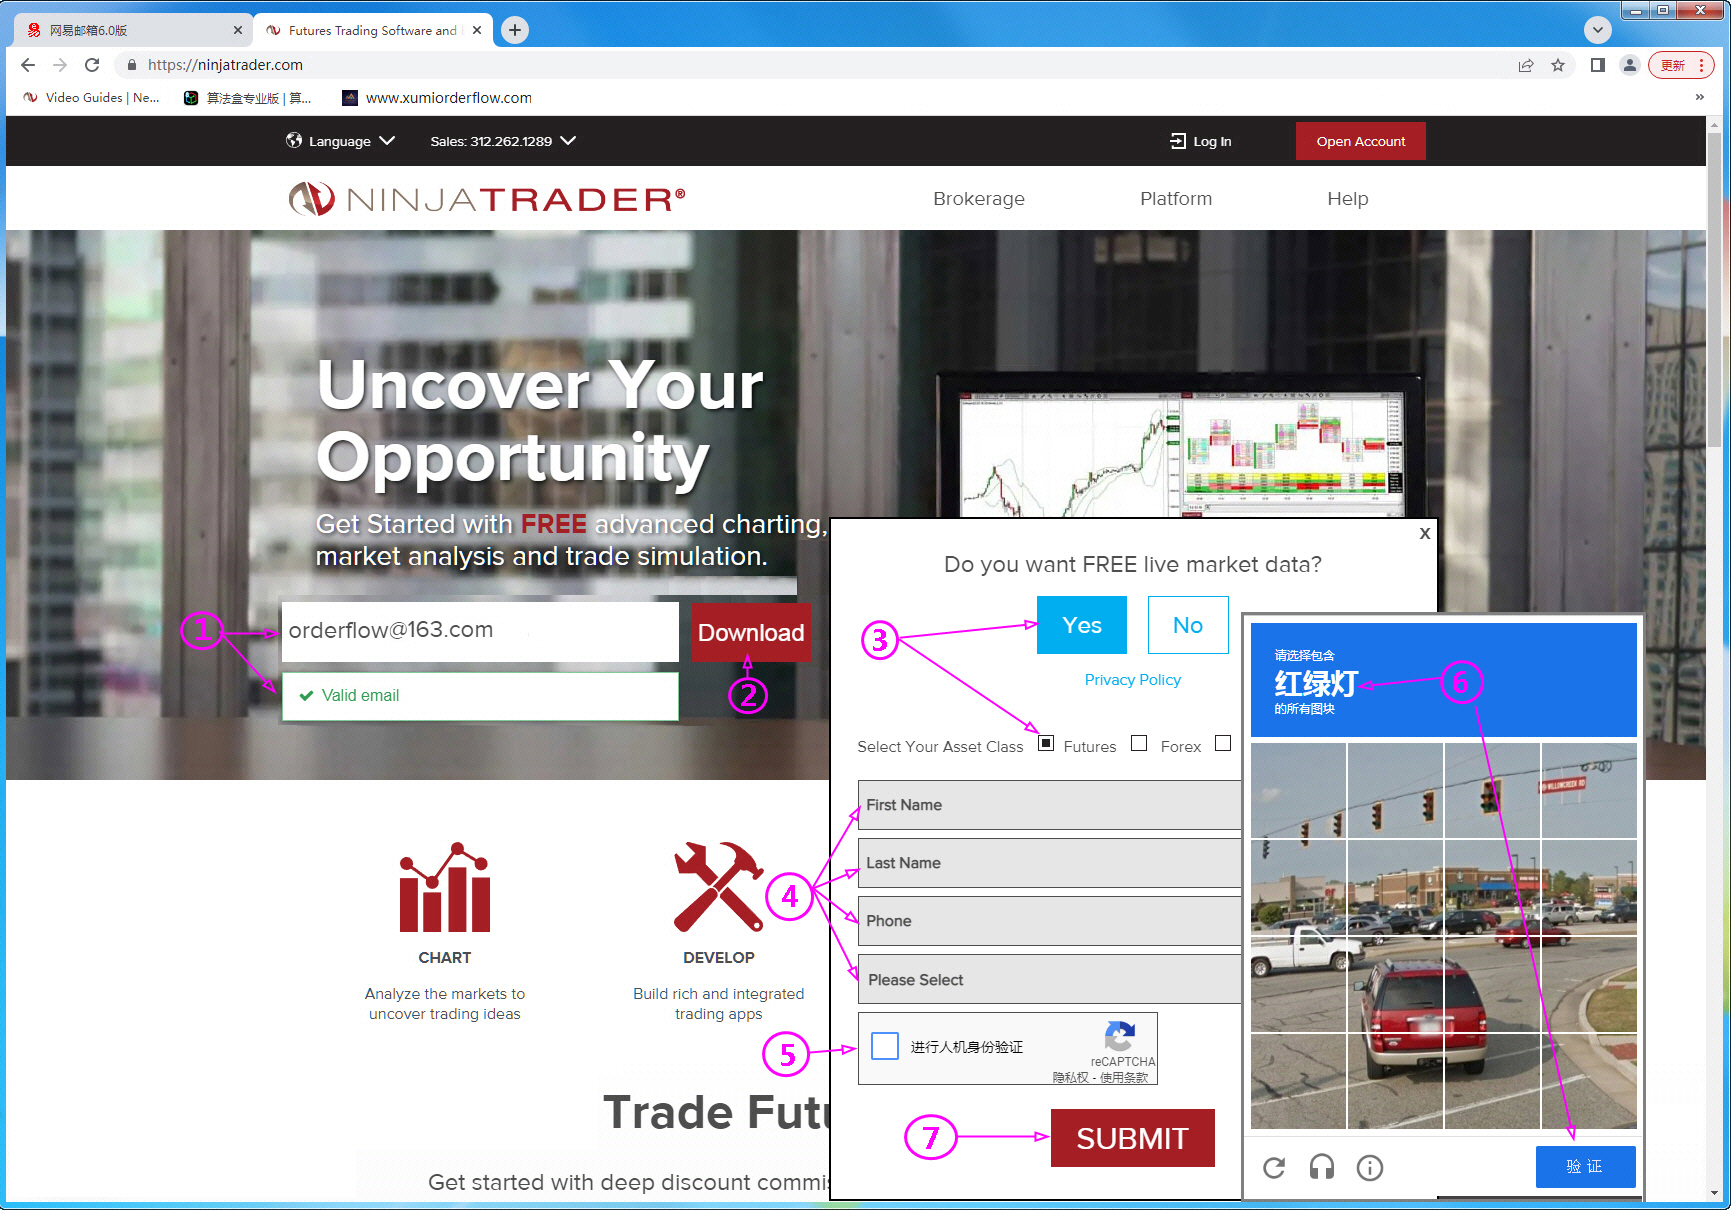
3. Register via https://ninjatrader.com/ to obtain CME free futures market real-time data and retrieve the username and password.
① Open the NT homepage, enter the registered NetEase email address, and verify that the address is valid;
② Click “Download”;
③ Select “Yes” and “Futures”;
④ Enter the relevant information such as “First Name”, “Last Name”, “Phone”, and “Please Select”;
⑤ Check “Perform Human Verification”;
⑥ In the pop-up information box, select the corresponding image and click “Verify”;
⑦ After passing the verification, click “SUBMIT” to complete the data registration.
4. Successfully apply for CME free futures real-time data and obtain a username and password.
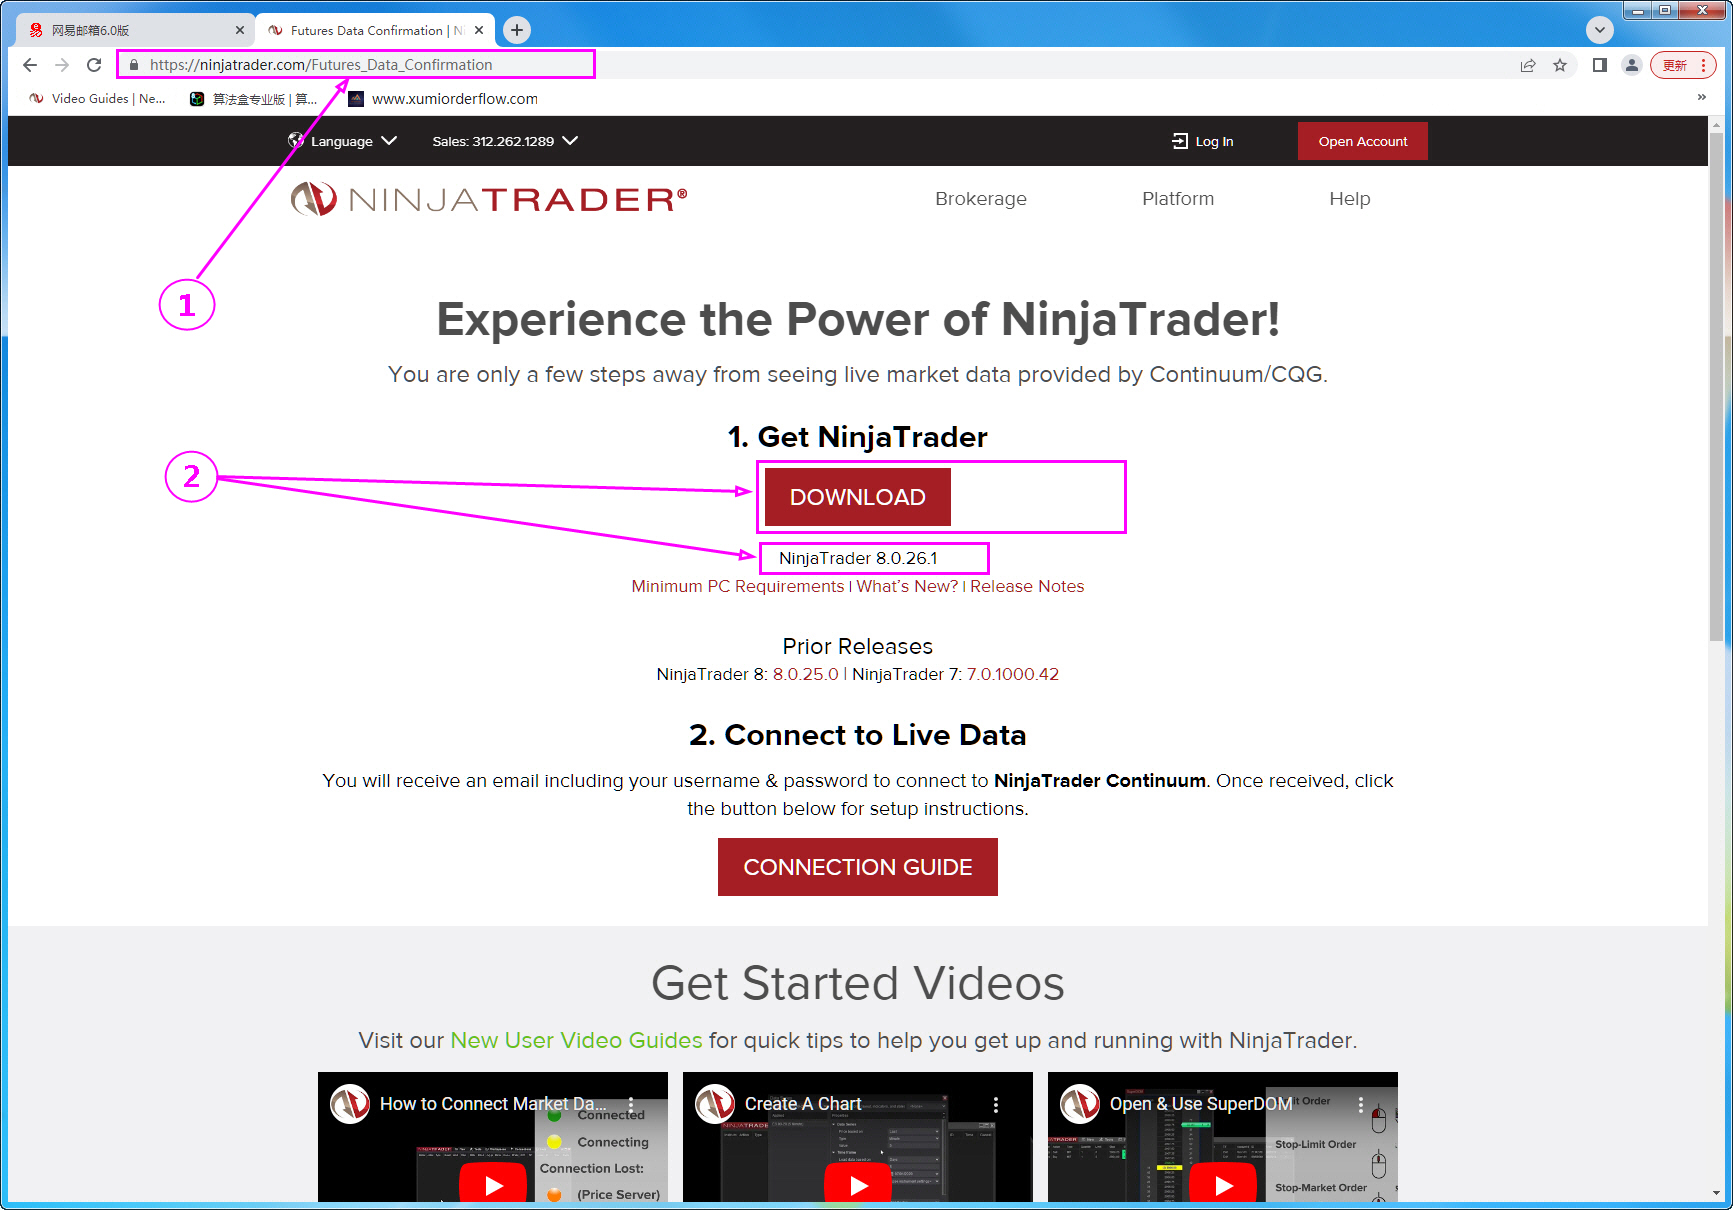
① After completing data registration, the webpage redirects to the NT main program download page, indicating that the CME free futures real-time data application has been successfully submitted. The username and password will be sent to the NetEase email inbox.
② Download the latest version of the NinjaTrader installation program.
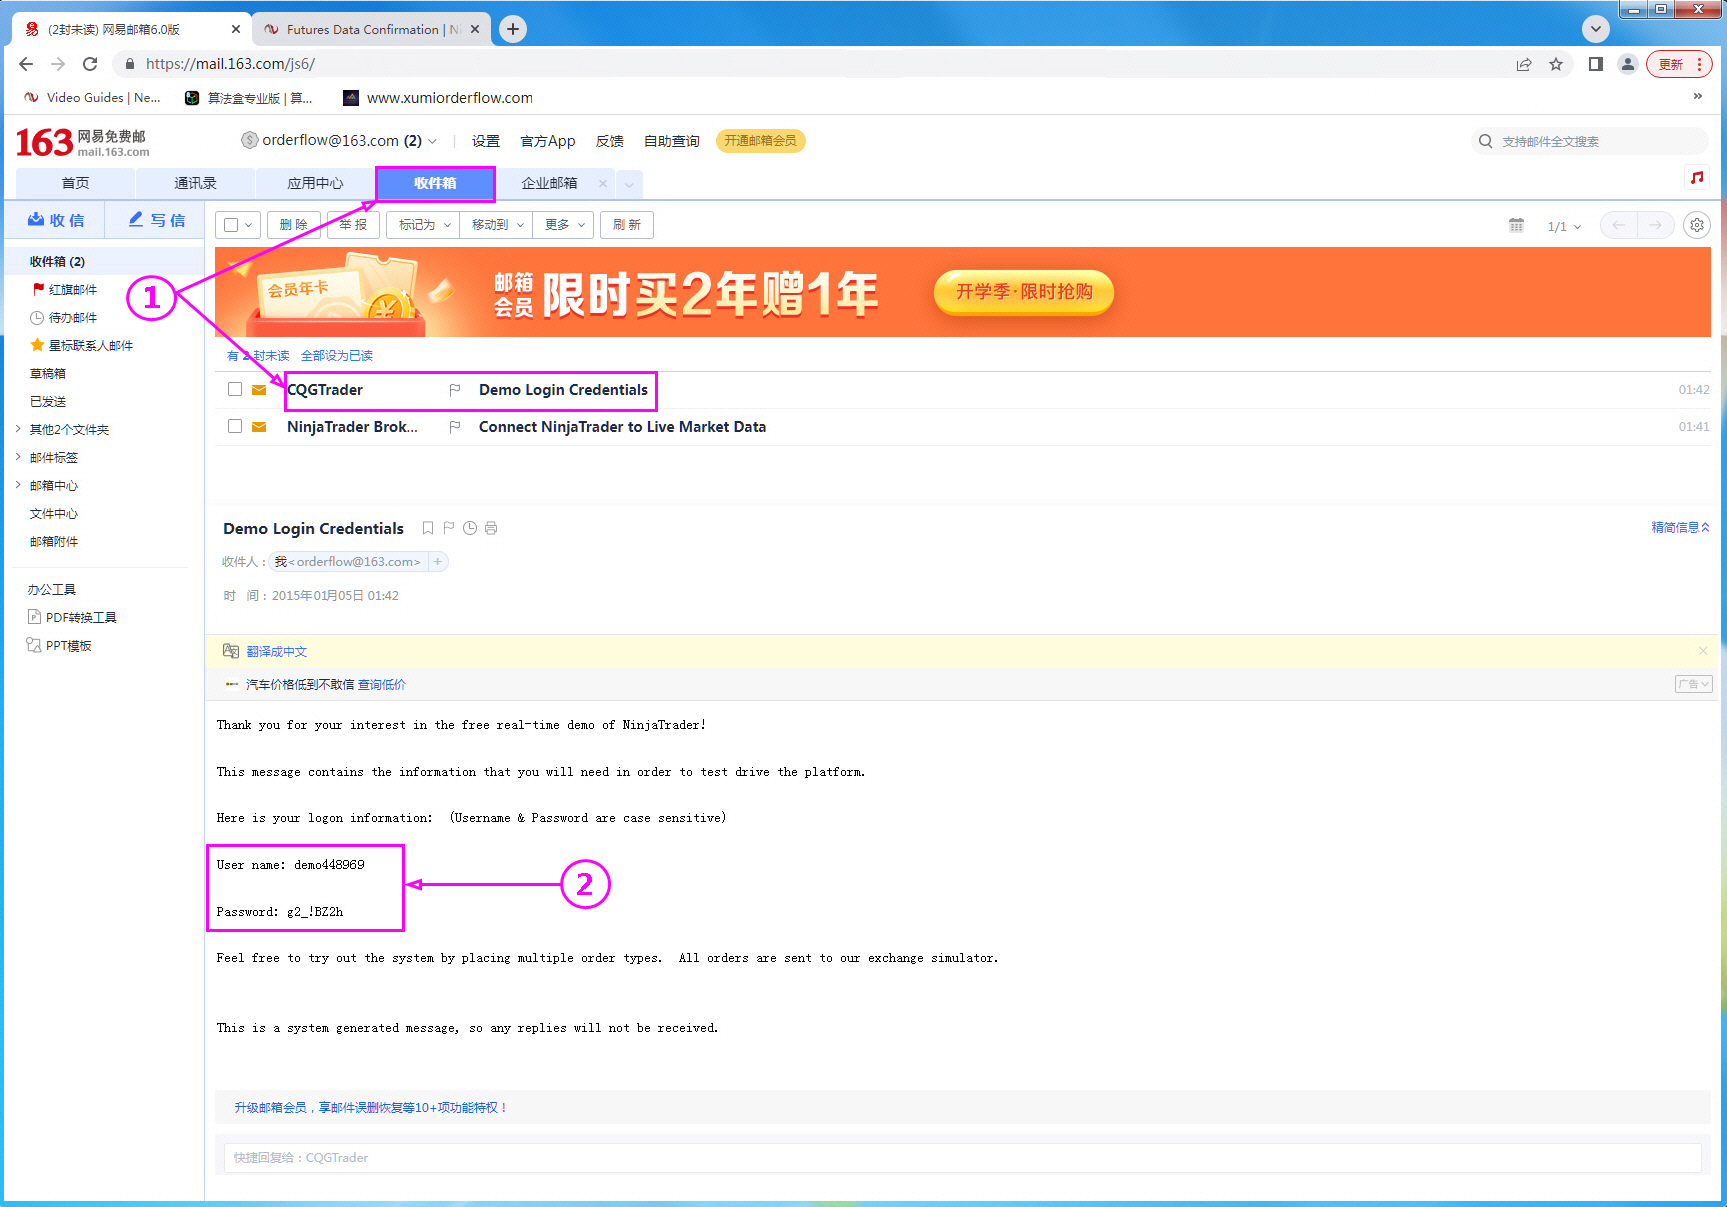
5. Return to the registered NetEase email inbox to receive and obtain the market data username and password.
①In the “Inbox,” select “Demo Login Credentials” to open the email.
② Obtain the real-time market data “Username” and “Password.”
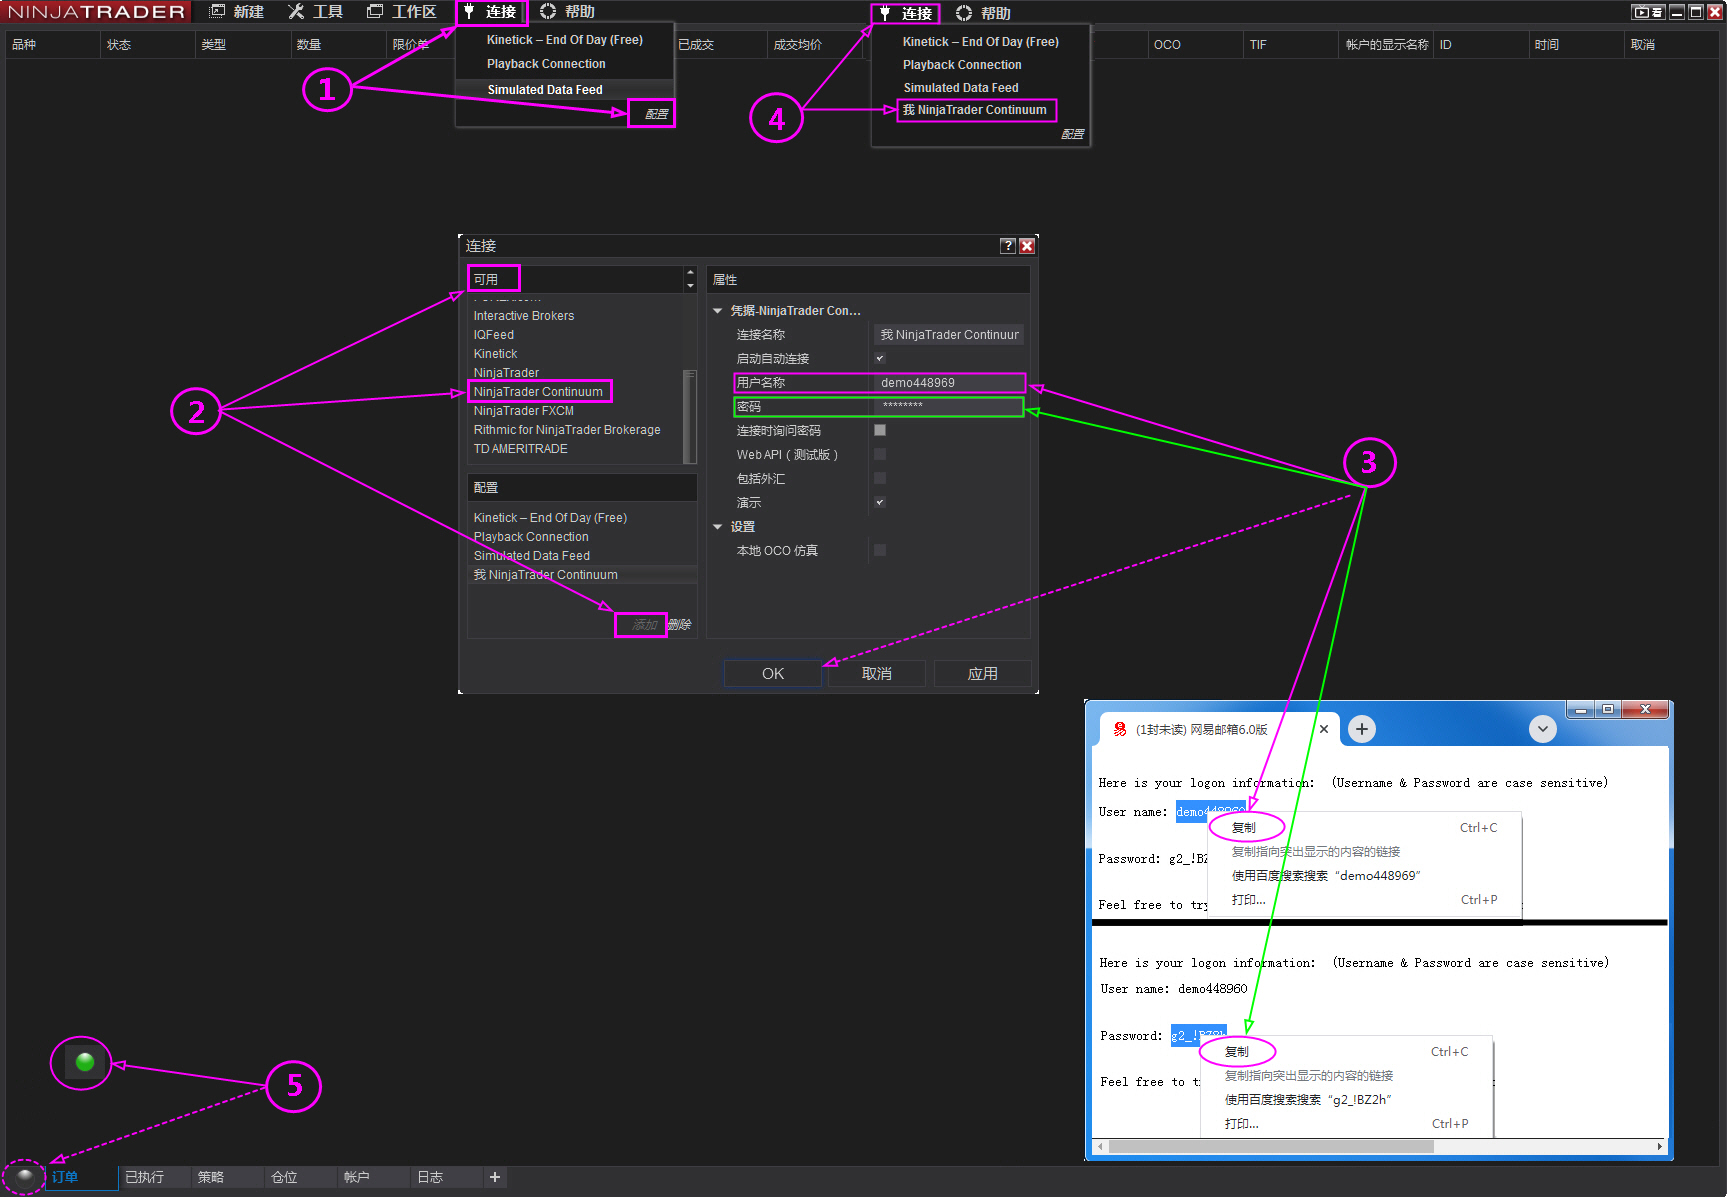
6. Access CME futures market real-time data.
① Open the Ninjatrader software “Connections” dropdown menu and select “Configure.”
②From the “Available” data providers, select “NinjaTrader Continuum” and click “Add.”
③ Return to NetEase mailbox, copy “Username” and “Password” separately, and paste them directly into the “Username” and “Password” fields of the “Connection Window”. Check “Enable Auto Connection” and “Demo”, then click “OK“;
④ Return to the Ninjatrader software “Connections” dropdown menu and select “NinjaTrader Continuum“;
⑤ The globe icon turns green, indicating successful reception of market data.
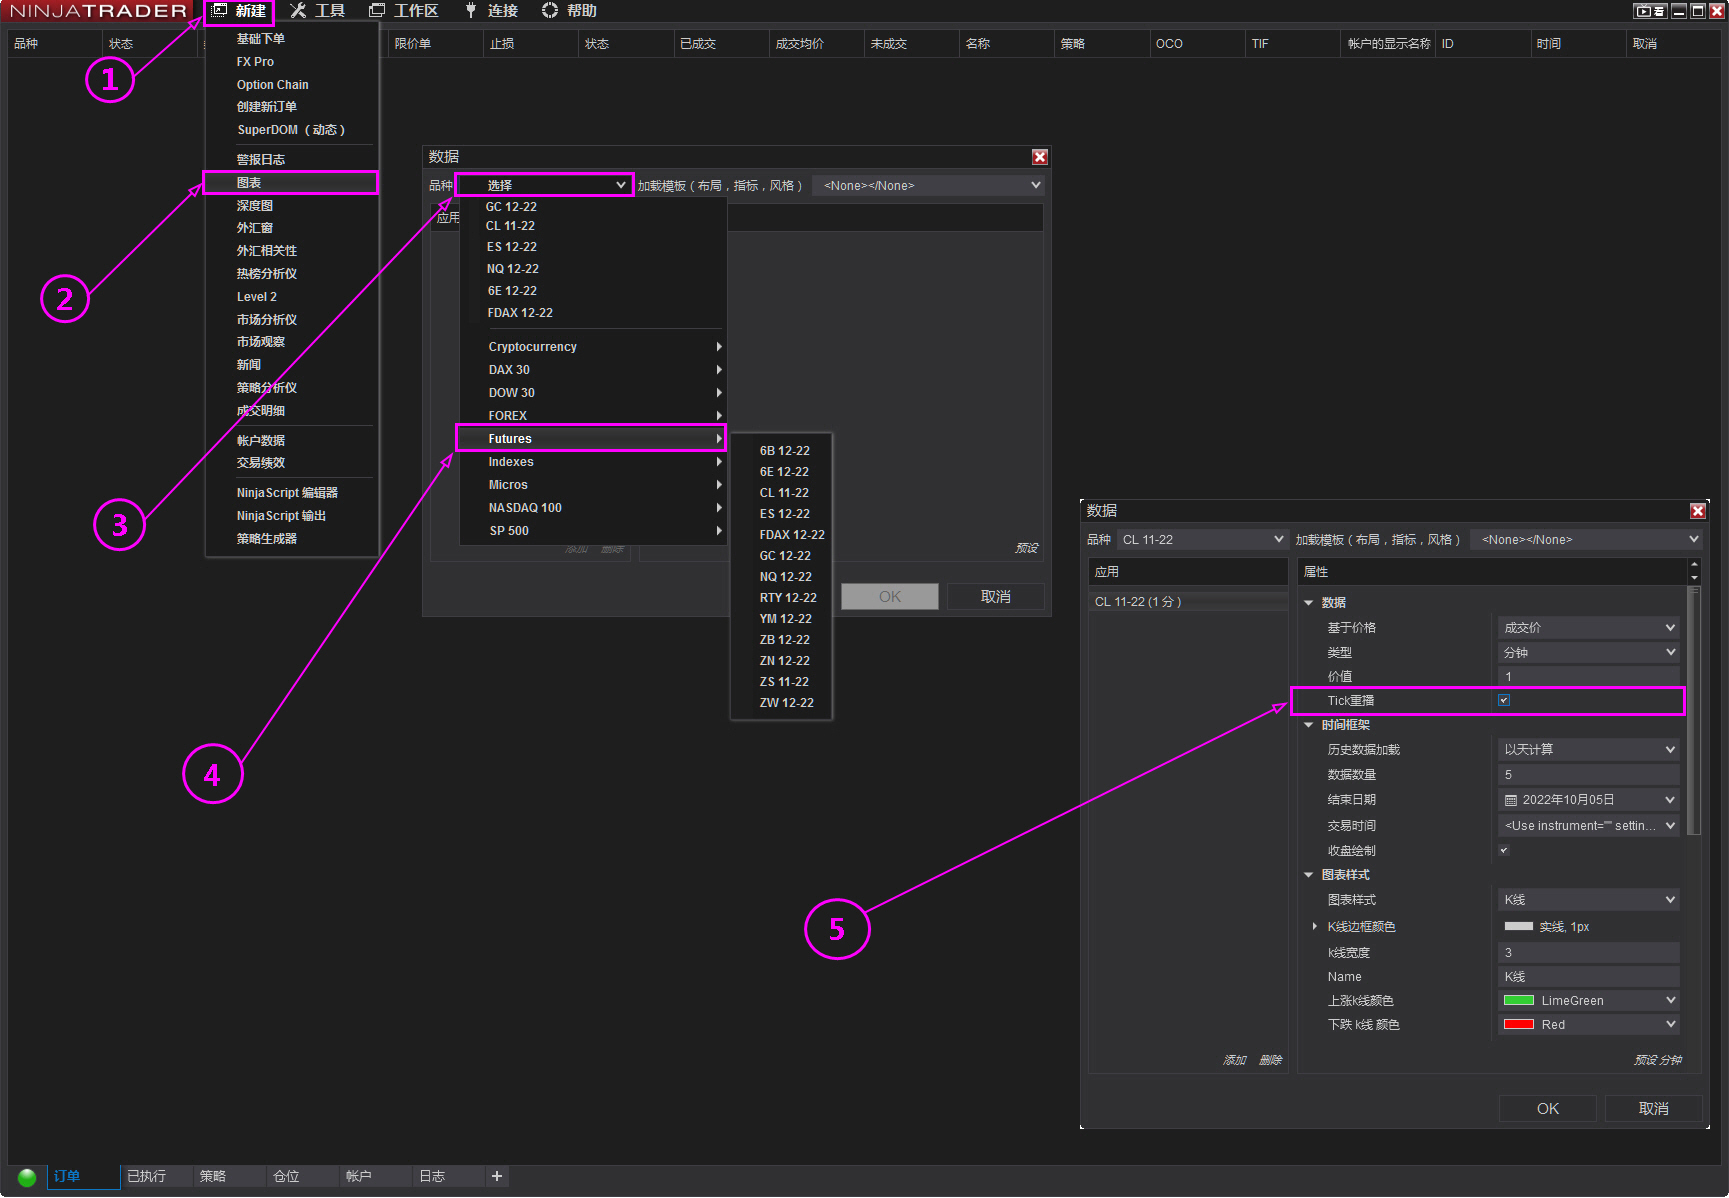
7. View real-time futures market data for CME main contracts.
① Open the Ninjatrader software “New” dropdown menu;
② Select “Chart”;
③ In the data window, click “Select”;
④ Scroll down and select “Futures” to view related instruments.
⑤ Be sure to check “Tick Replay“
1.5.2 Example of accessing financial and commodity market data from China’s four major futures exchanges (fee-based).
1. To use the “Order Flow Xumi Footprint” indicator in the Ninjatrader platform software, you must selectTick format financial futures market data (refer to 1.5.1.1).
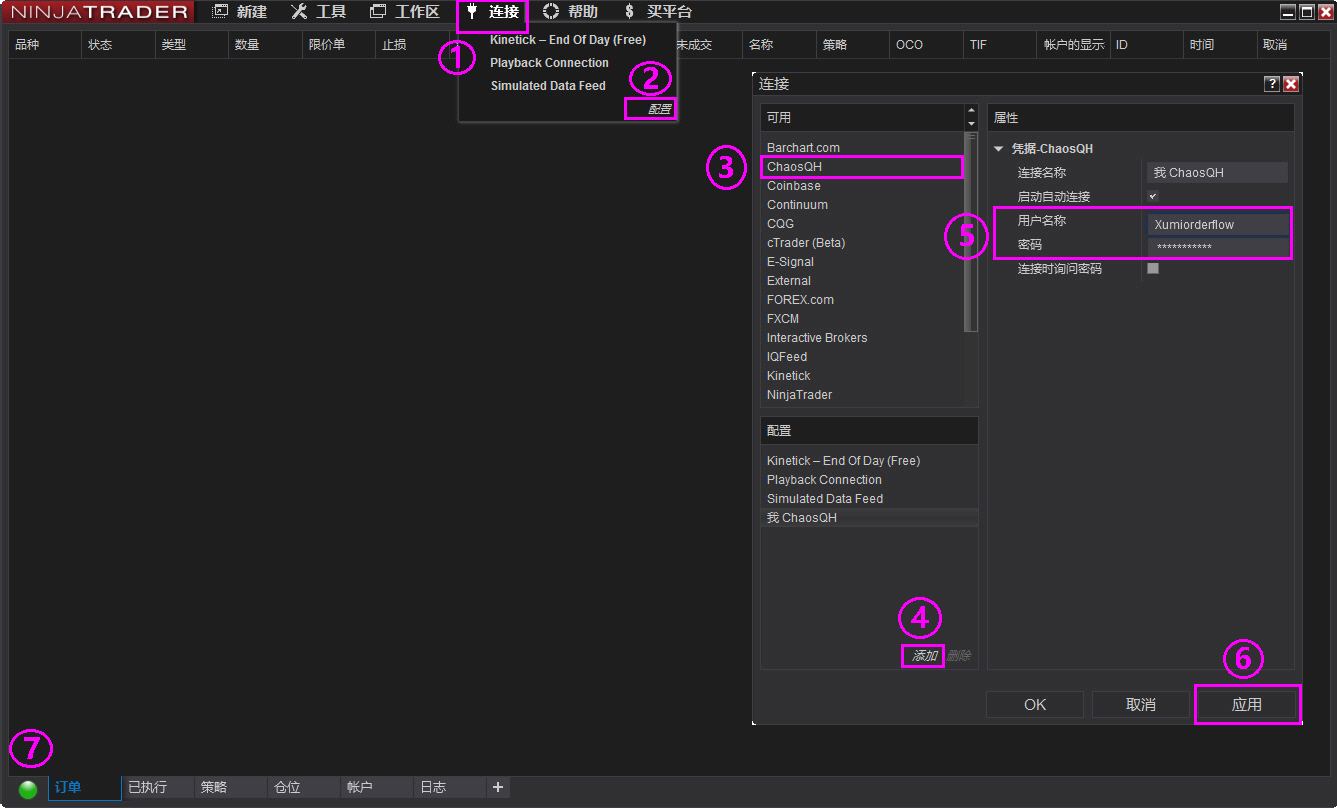
2. Obtain real-time market data from China’s four major futures exchanges.
① Open the “Connections” dropdown menu in the Ninjatrader software;
② Select “Configure”;
③ From the “Available” data providers, select “ChaosQH”;
④ Click “Add”;
⑤ Enter “Username/Password” (contact the data provider to activate permissions; the above data is exclusively provided by Chaos Futures);
⑥ Click “Apply”;
⑦ The globe icon displays green, indicating successful reception of market data.
3. View real-time futures market data for the main contracts of the China Financial Futures Exchange, Shanghai Futures Exchange, Dalian Commodity Exchange, and Zhengzhou Commodity Exchange.
① Open the “New” dropdown menu in the Ninjatrader software;
② Select “Chart”;
③ In the data window, click “Select”;
④ Scroll down and select “Main Contract” or “Continuous Contract” to view the relevant instruments.

II. Overview of the Xumi Order Flow Chart Market Decision System Development Environment and Functional Applications
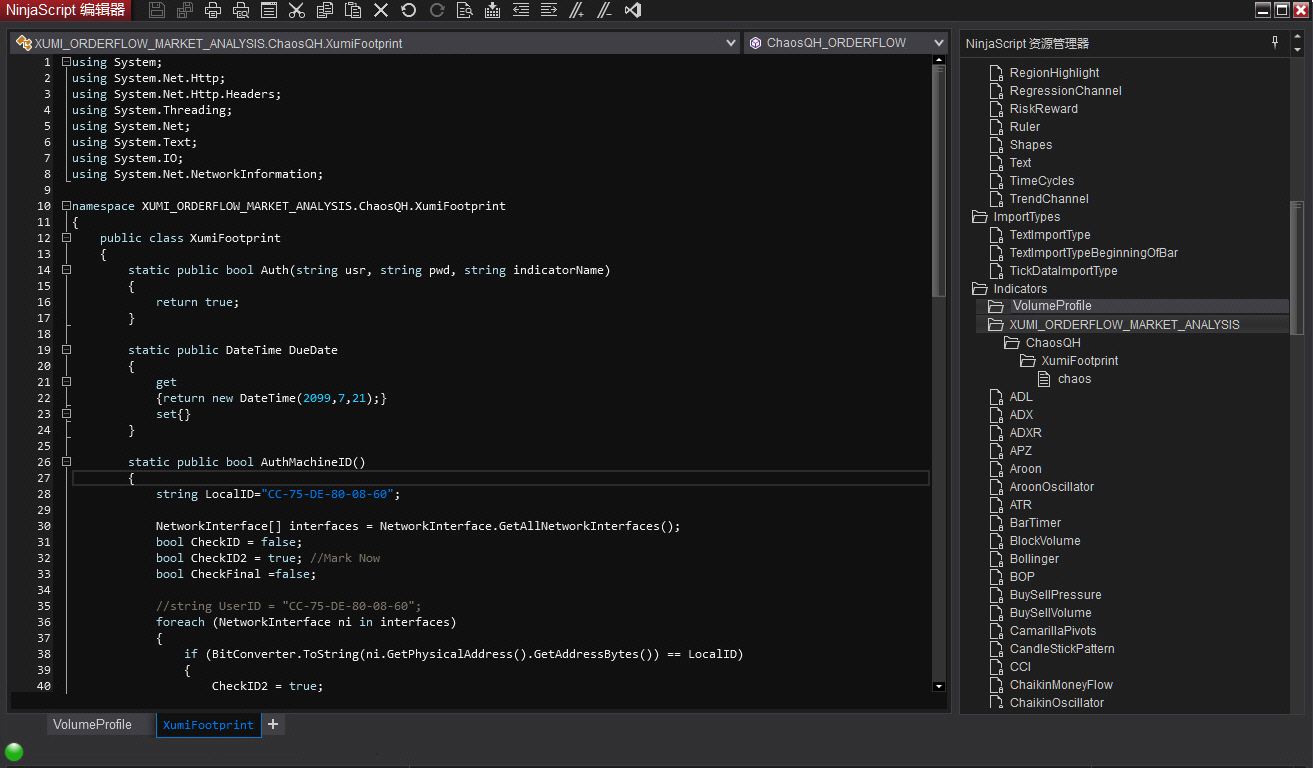
2.1 Order Flow Trading System Indicator Development Language Environment
The Xumi Footprint Chart Market Decision System is based on the NinjaTrader software trading platform, running in the Microsoft Visual Studio integrated development environment provided by Microsoft, and developed using the Microsoft C# language in the .NET Framework environment.
2.2 Requirements for the Order Flow Trading System Operating Environment and Computer Configuration
1. Operating Environment: Microsoft Windows 64-bit operating system
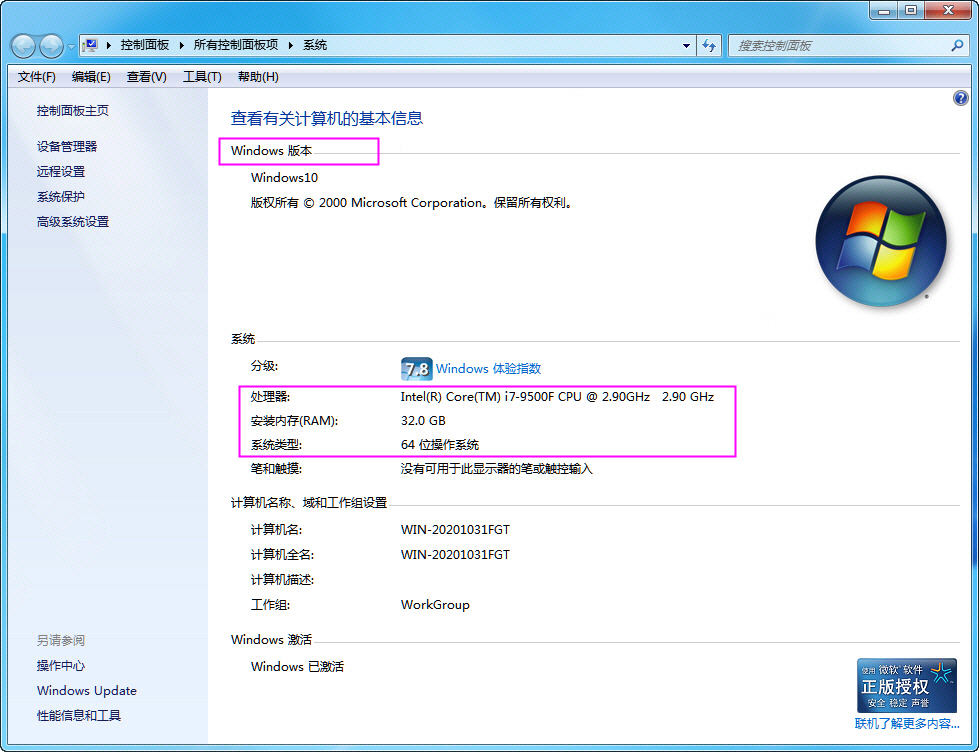
2. Computer Configuration:I5 processor,6GB dedicated graphics card,16GB RAM,512GB SSD32/38/43/49-inch4K monitor, it is recommended to useDell38/Dell49-inch curved widescreen monitor.
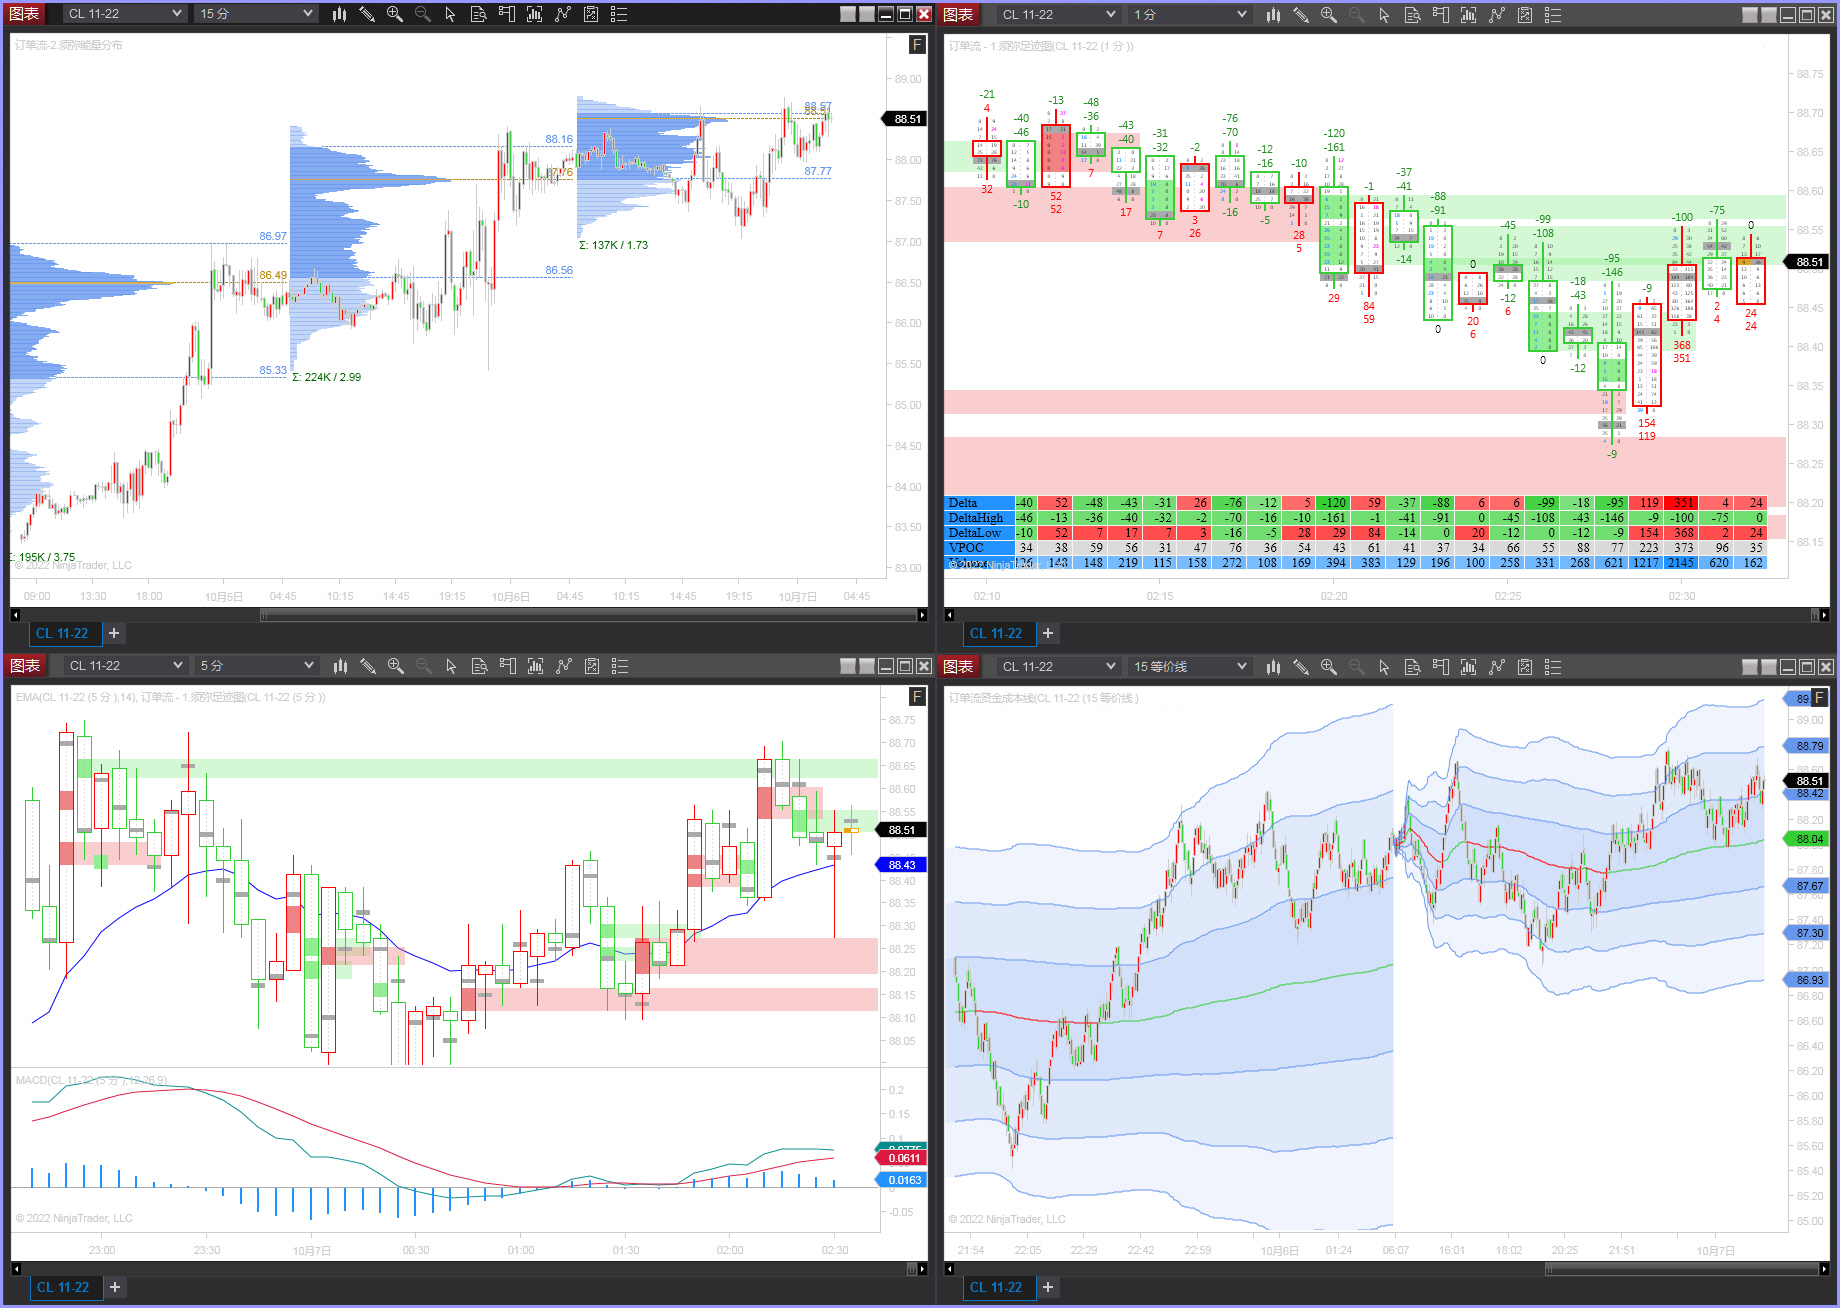
2.3 Order Flow Trading System Function Overview
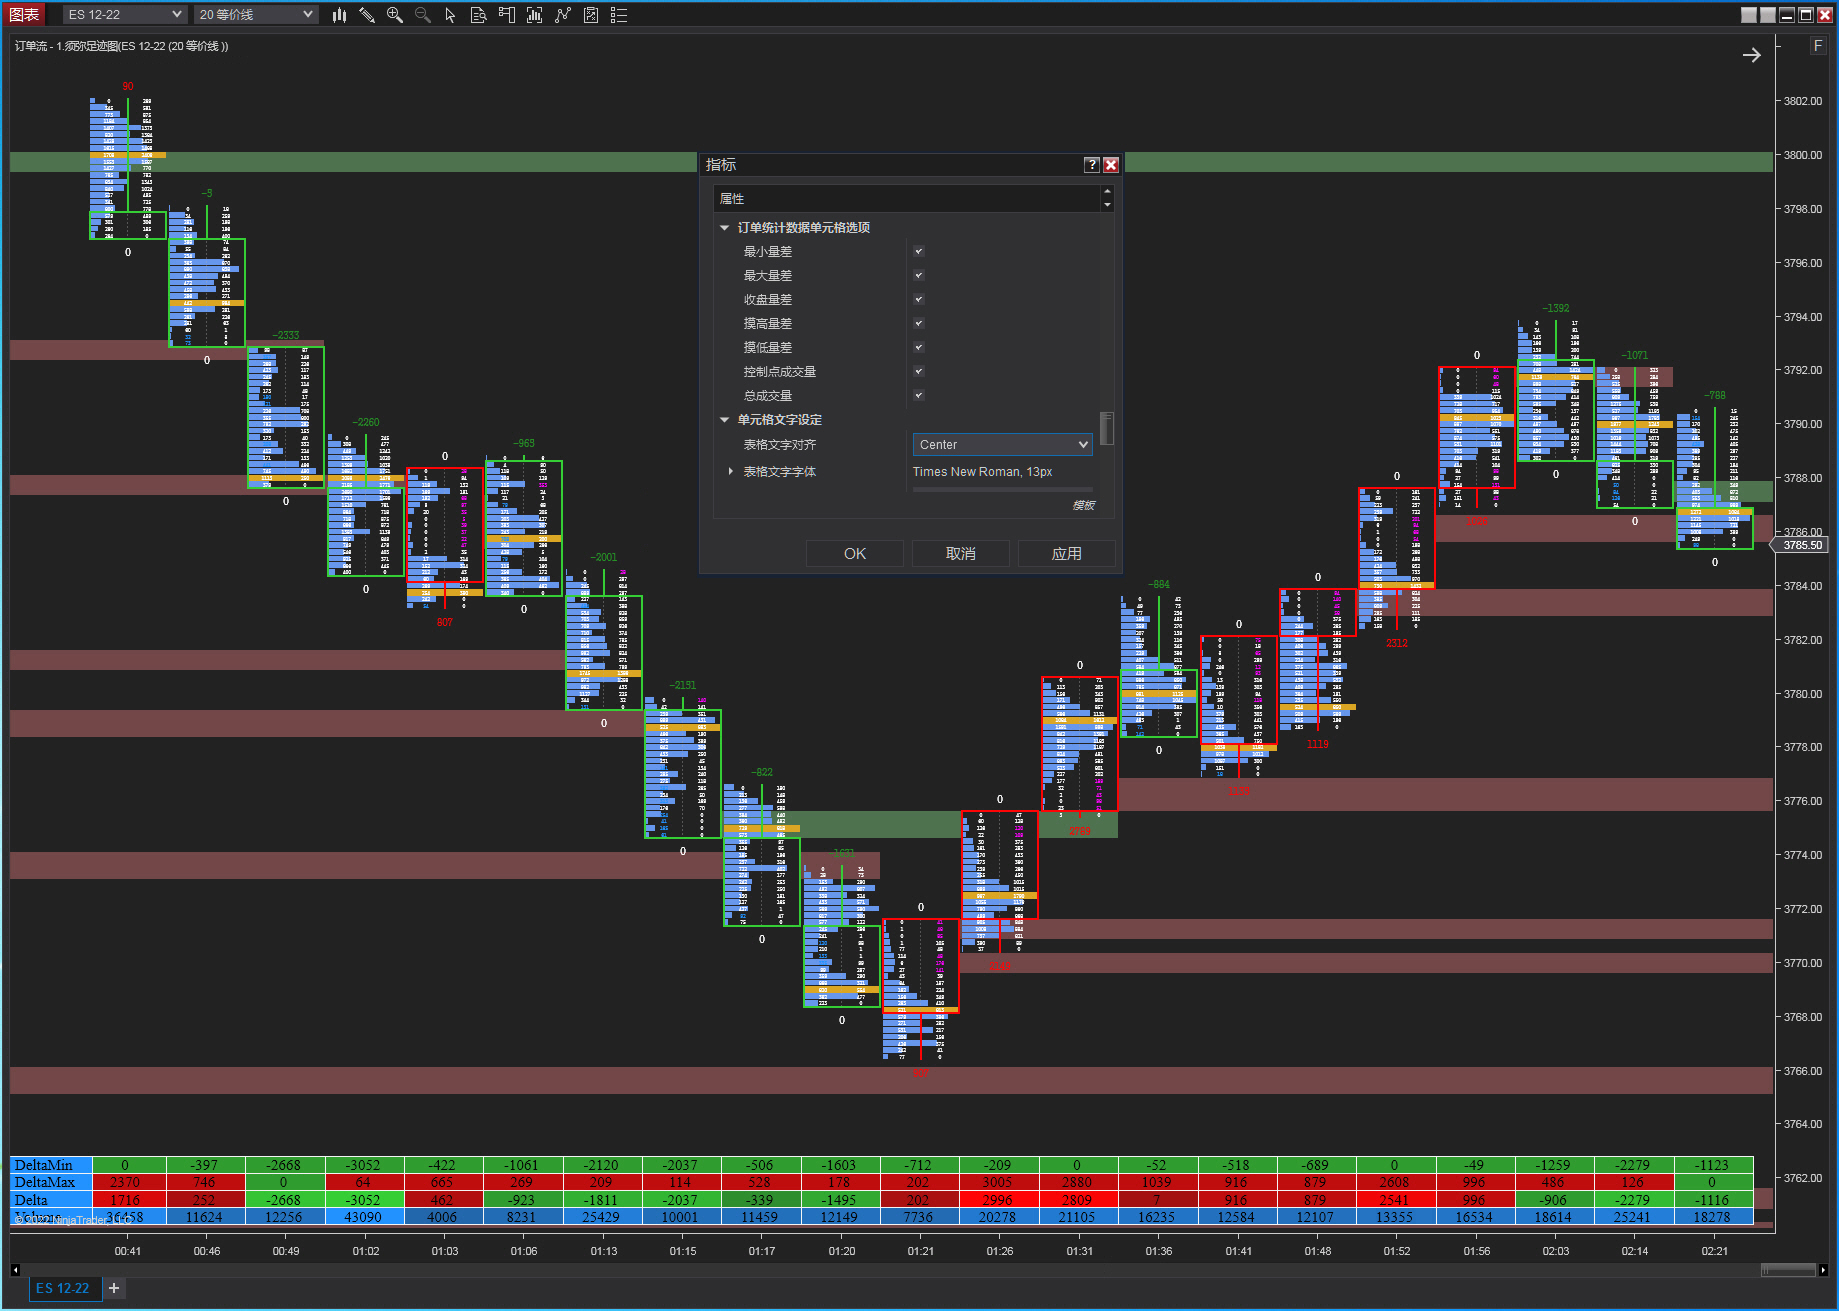
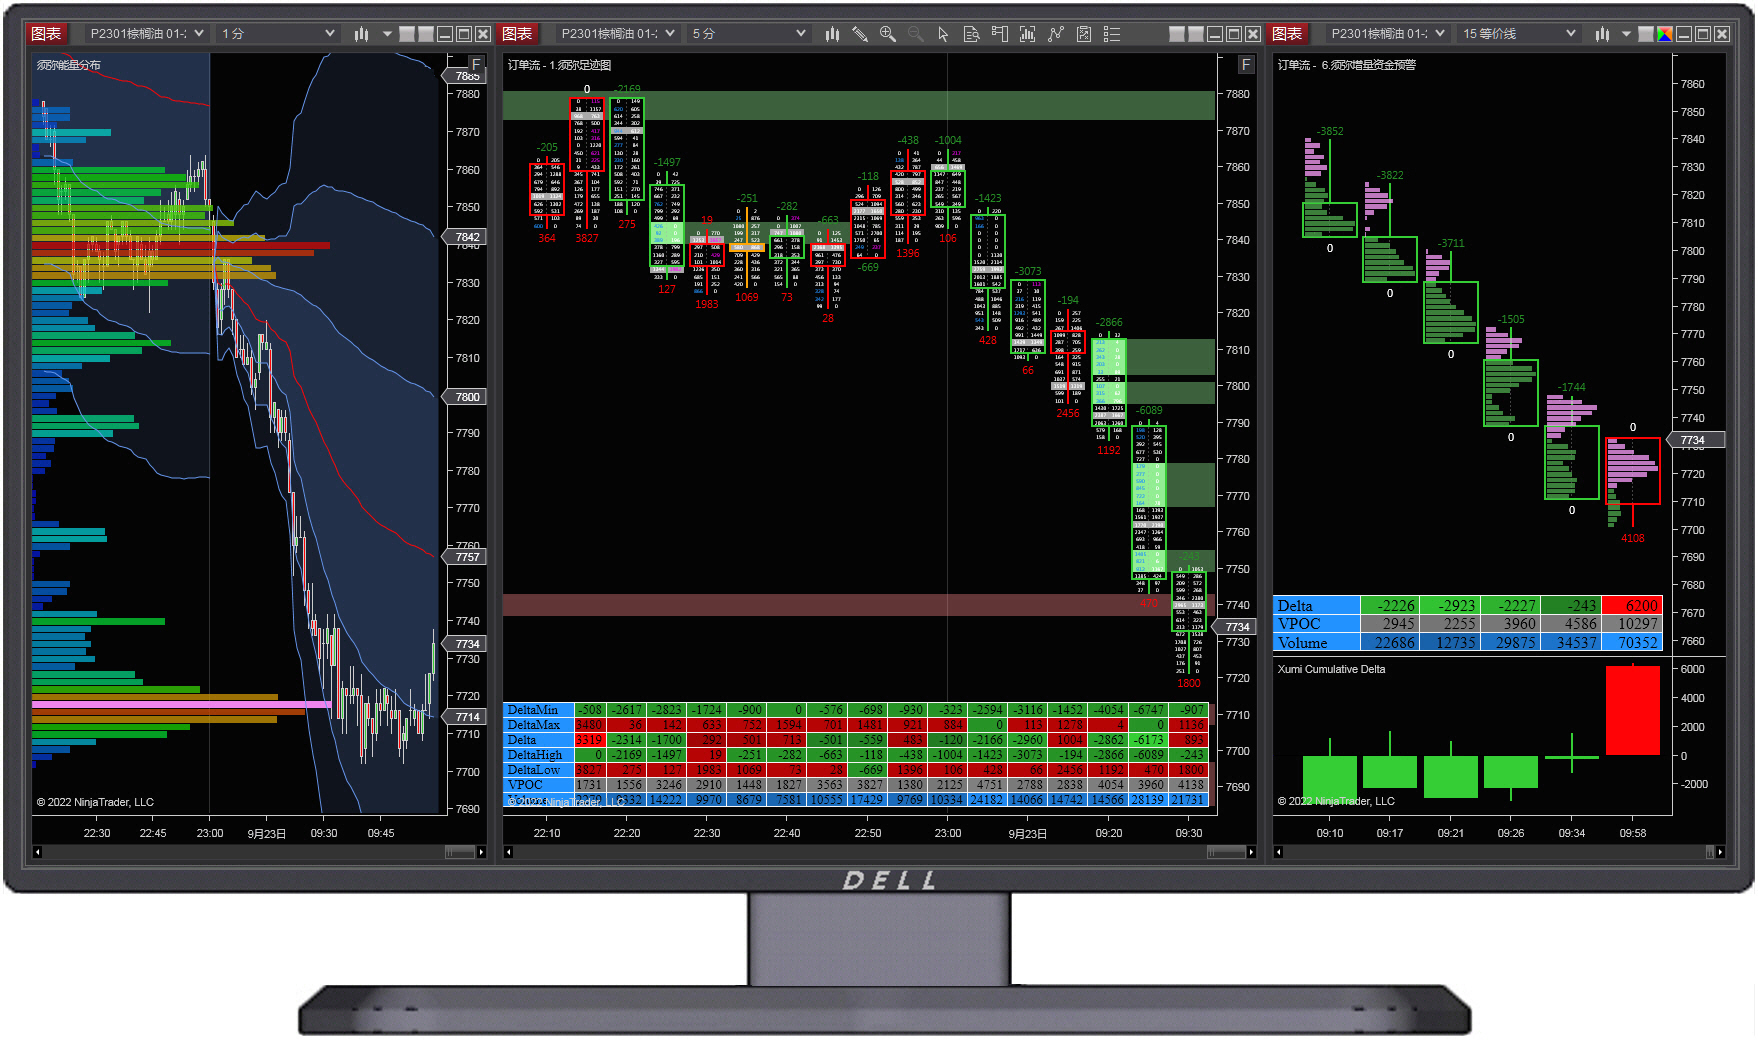
Statistics of tick-level trade dataTick, displayed and recorded in two columns on the left and right within each candlestick chart on the screen, listing the executed orders at each horizontal price level for the ask side(sell side) and bid side(buy side). Visualize the Point of Control(POC), volume clusters(Cluster), order supply-demand imbalance(Imbalance), and order flow delta(Delta) formed by executed order data in each candlestick chart, and dynamically draw a volume profile histogram(Volume Profile) on the left side of the screen at each horizontal price level based on executed orders.
2.4 Order Flow Trading System Applications
Fully supports the mainstreamNinjaTrader platform, utilizes Xumi Volume Profile to display the macro market, reveals micro structures through Xumi Footprint Chart, monitors order execution dynamics in real time, visualizes trade data, professionally identifies large market orders, tracks large capital movements, and helps traders make precise decisions.
Legal Notice:
This website strives for accuracy and completeness of the content provided, but makes no guarantees regarding its accuracy or completeness. Any direct or indirect losses resulting from the use of this website or external links are the sole responsibility of the user.
The content provided on this website is protected by relevant national copyright laws. No individual or organization may copy, modify, print, or disseminate it for other purposes, unless otherwise agreed upon by the website owner and the relevant parties; otherwise, legal liability will be pursued. All information provided on this website (including but not limited to market data, market statistics, etc.) and the intellectual property rights of related software programs belong to this website..
FAQ
What does an order flow toolkit include?
A complete order flow toolkit typically includes a footprint chart, volume delta, imbalance alerts, a large-order detector and a capital-cost line — built for futures traders on MultiCharts and NinjaTrader.
Who is order flow trading for?
Mainly short-to-medium-term futures and forex traders who want to read institutional activity and volume clusters, and to confirm entries/exits at key price levels — order flow works best as confirmation, not as a standalone signal.
What data does order flow analysis need?
Tick-level bid/ask data. Footprint charts and volume delta are only as accurate as the underlying feed — low-quality data distorts the footprint.
Which platforms support order flow tools?
Professional futures platforms such as MultiCharts and NinjaTrader, paired with the corresponding order flow indicators for footprint, delta and imbalance alerts.
How do I read a footprint chart?
A footprint chart splits each candle to show buy volume (traded at ask) versus sell volume (traded at bid) at every price. Watch three things: where volume clusters, whether delta direction agrees with price, and whether high-volume levels hold afterwards — a held level signals real absorption.
Can order flow be used in automated or quant trading?
Yes. Order flow indicators run on programmable platforms like MultiCharts and NinjaTrader, and quant traders commonly use footprint, delta and imbalance readings as micro-confirmation signals inside their own strategy logic.
Can order flow be used on Taiwan stocks or TAIEX futures?
Yes, if the data supports it. Order flow needs tick-level bid/ask trade data — TAIEX index futures (TAIFEX) and overseas futures provide this through the futures feed, so footprint charts and volume delta render fully, which is why Taiwanese traders commonly apply order flow there. For individual Taiwan cash equities it depends on the broker feed's tick precision; low precision distorts the footprint. In practice order flow is most established on index futures and international futures. This page is a tool overview, not investment advice.