
描述
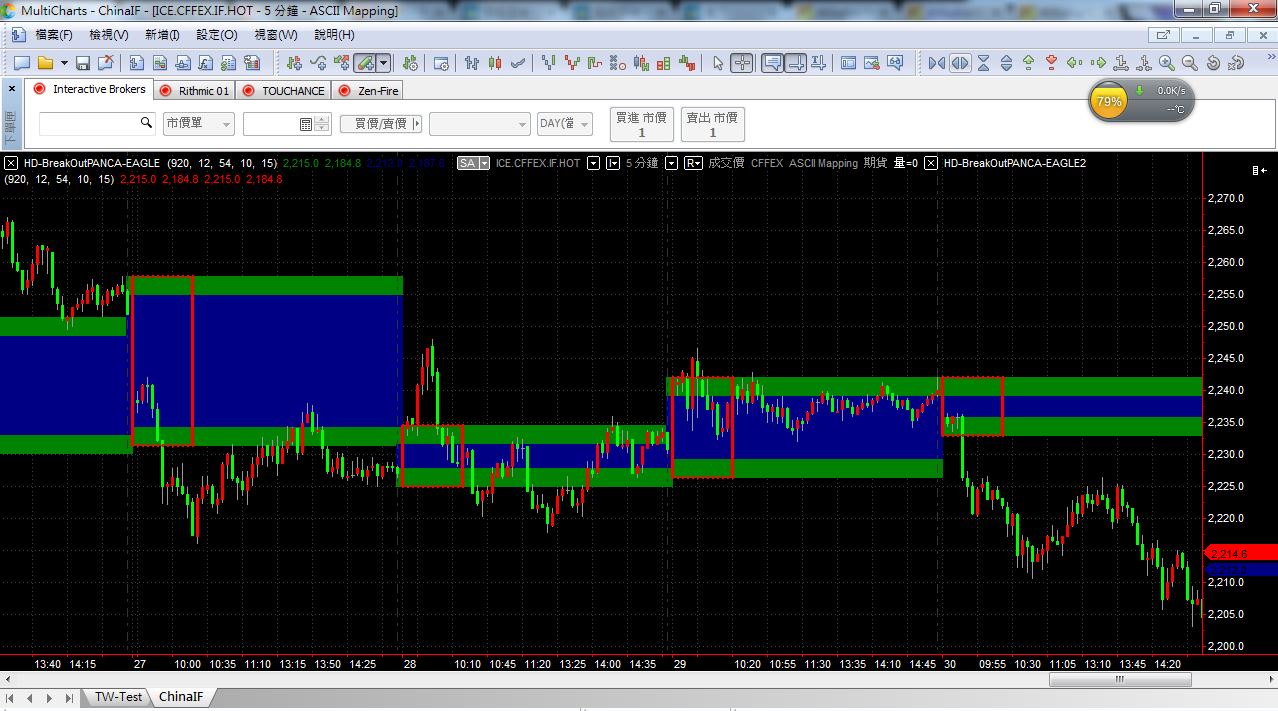
This is a very graphic Multicharts indicator.
Mainly for intraday use, but can also provide a good reference for overnight trends.
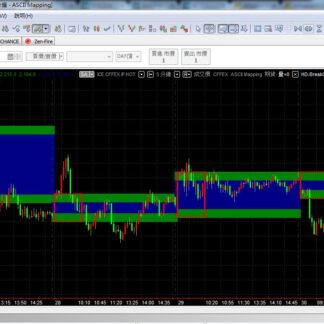
It can be set up to grab a time period after the opening and draw a rectangle.
And in the all session, the color band shows the possible range of the swing.
For traders, it provides a very clear help.
这是一个很图像化的Multicharts指标,
主要作为日内之用,但对于隔夜走势也可以提供还不错的参考。
它可以透过设定,抓取开盘之后某一段时间区块,画出矩形来,
并且在全天域的走势中,以色带来显示可能的走势范围。
对于交易员,能够提供一个很清楚的看盘辅助依据。
Because this’s source code product, sorry we don’t provide the refund service if after buying. Thanks for your understanding!
此为源代码产品,所以若经购买后,很抱歉无法提供退货服务,请多见谅!
评价
目前还没有评价