描述
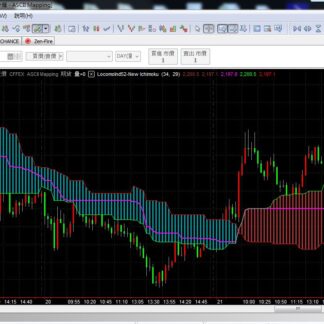
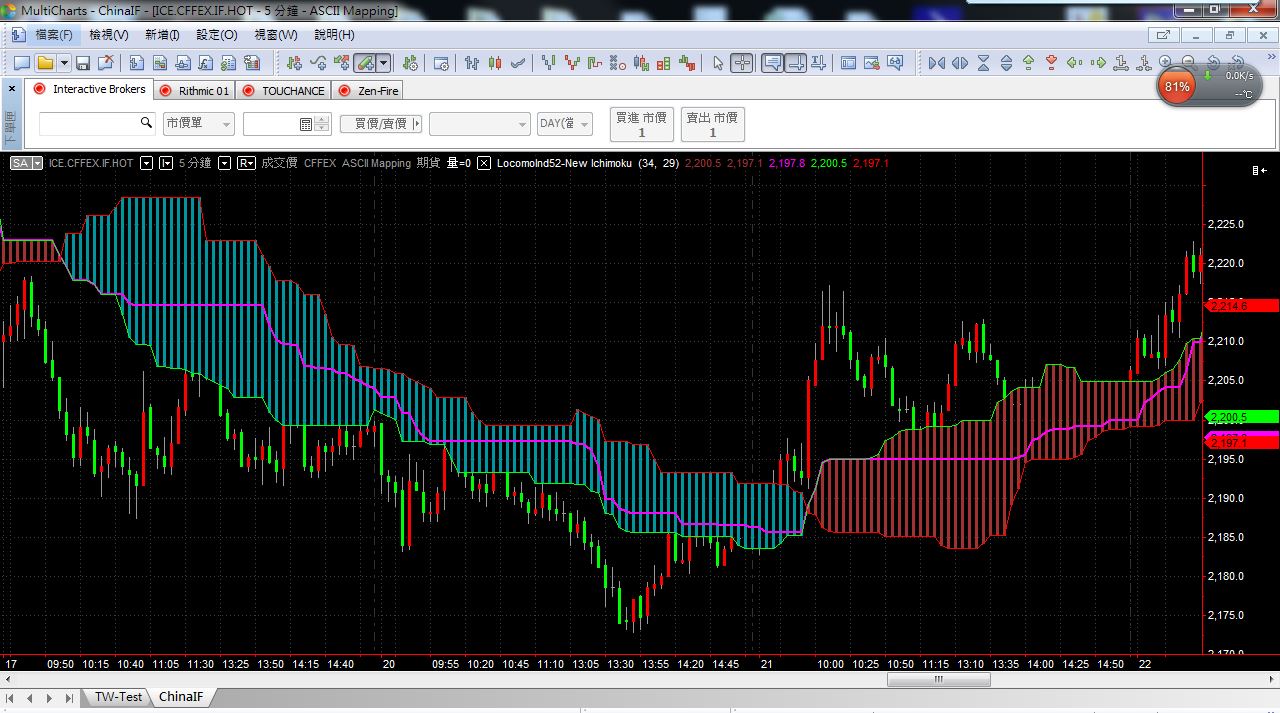
這是一個改編自著名的一目均衡圖(Ichimoku)之Multicharts指標,
加入了新的元素之後,它可以更加清楚地繪出壓力和支撐帶的區域,
能夠幫助交易員瞭解到目前所處的位置,以及該注意的價格區帶。
This is an adaptation Multicharts indicator from the famous Ichimoku.
With the addition of new elements, it is possible to draw the area of resistance and support band more clearly.
Its ability is to help the traders understand where the market stands on currently and which price zone need to pay attention to.