描述
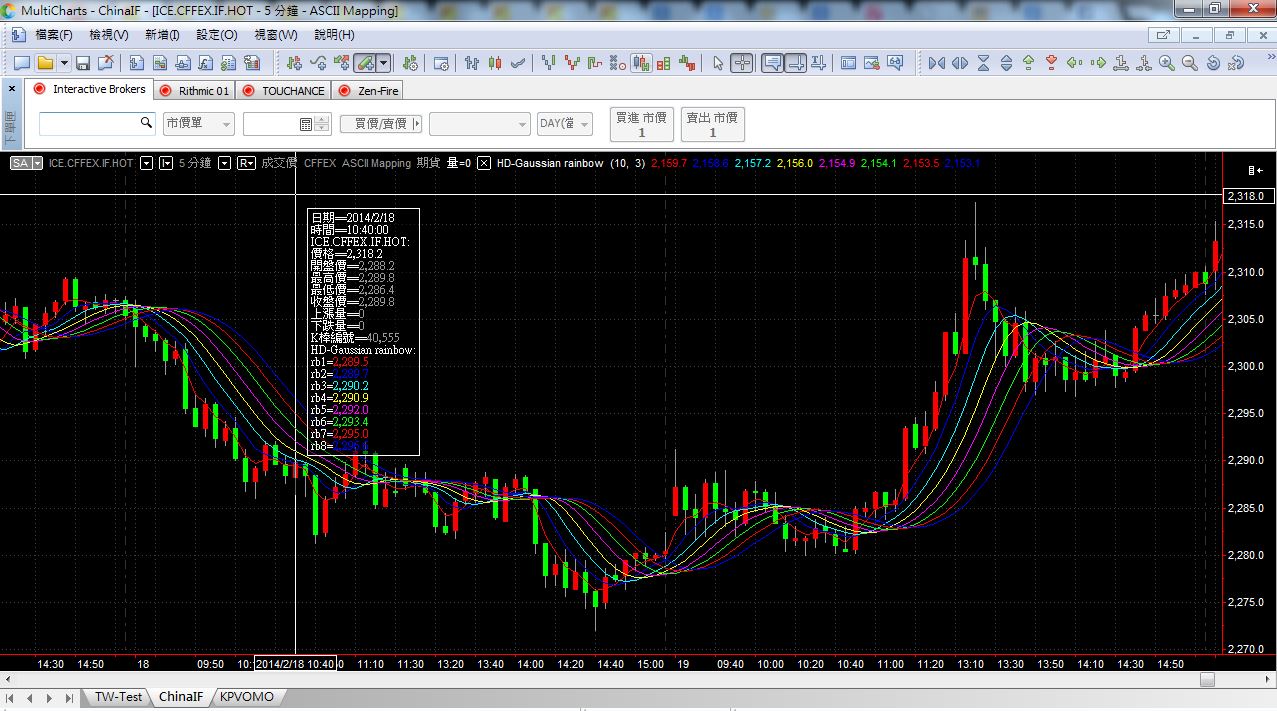
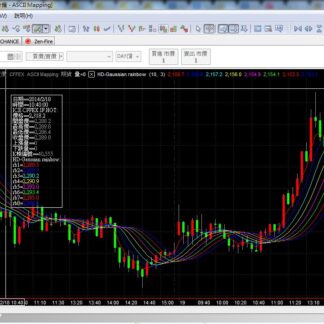
This is a MultiCharts indicator, which is structured as a mathematical function of Gauss.
Displayed as a multiple line graph.
It can help traders find out if the trend is slowly changing.
That’s why it’s called the Gaussian Rainbow indicator.
$79.00
This is a MultiCharts indicator structured as a mathematical function of Gauss, displayed as a multiple line graph. It helps traders identify slowly changing trends.
数字下载 · 下载后恕不退款
商品付款后立即通过你的账户与订单 email 交付。因为这是代码类数字商品,下载后文件已永久存在你的设备上,无法回收,因此一经下载我们无法受理退款。若文件无法下载或与商品描述明显不符,请于 7 天内联系我们,每封信我们都会读。 完整退款政策 →
This is a MultiCharts indicator, which is structured as a mathematical function of Gauss.
Displayed as a multiple line graph.
It can help traders find out if the trend is slowly changing.
That’s why it’s called the Gaussian Rainbow indicator.
评价
目前还没有评价