描述
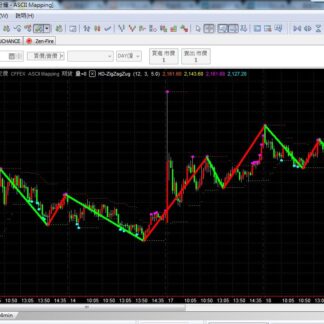
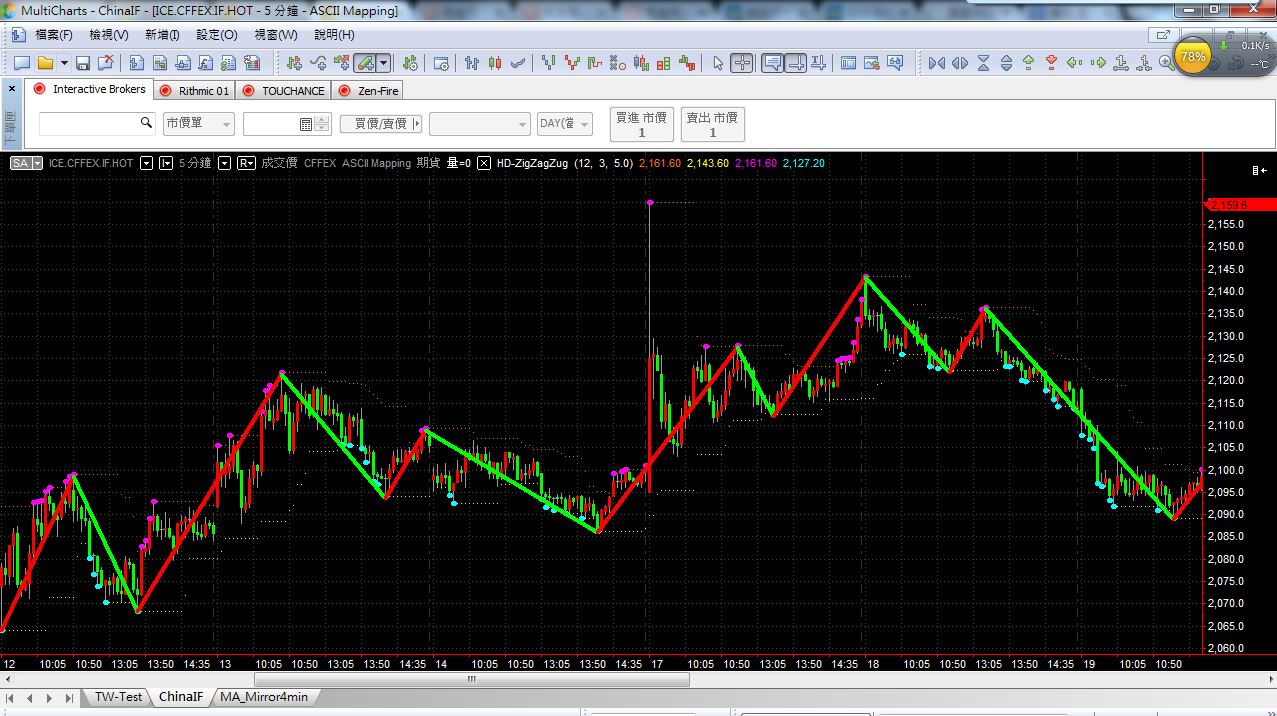
這是一個可以標記出每一波走勢線條的Multicharts指標。
它改善了原本的指標,同時將這些高低點以點狀的方式註記下來,
做為可能的支撐與壓力之參考價格。
但請注意,它是一個會隨著價格創高創低時不斷重畫的指標,
因此在盤中看到的線條,並不會像盤後如此完整漂亮。
但依舊可以從裡頭知覺到本波走勢是否有所改變了。
This is a Multicharts indicator that can mark the trend line of each wave.
It improves the original indicator while marking these highs and lows in dots as the reference prices for possible support and resistance.
But note that it’s an indicator that will keep redrawing as prices hit highs and lows.
So the lines that are seen in the session will not be as complete and beautiful as the end of session.
However, it is still possible to tell whether the trend of this wave has changed.