描述
This is an intraday indicator of Multicharts, developed from the experience of observing the market.
The approximate current cost price can be automatically calculated after the opening of each day, as the trend develops.
This indicator is therefore also known as the intraday cost line.
When the current price is above the cost line, it represents the majority of long positions that are profitable.
Conversely, it means that most of the short positions are profitable.
Therefore, it is easier to follow the direction to trade.
This is also an intraday indicator that I personally quite like to use.
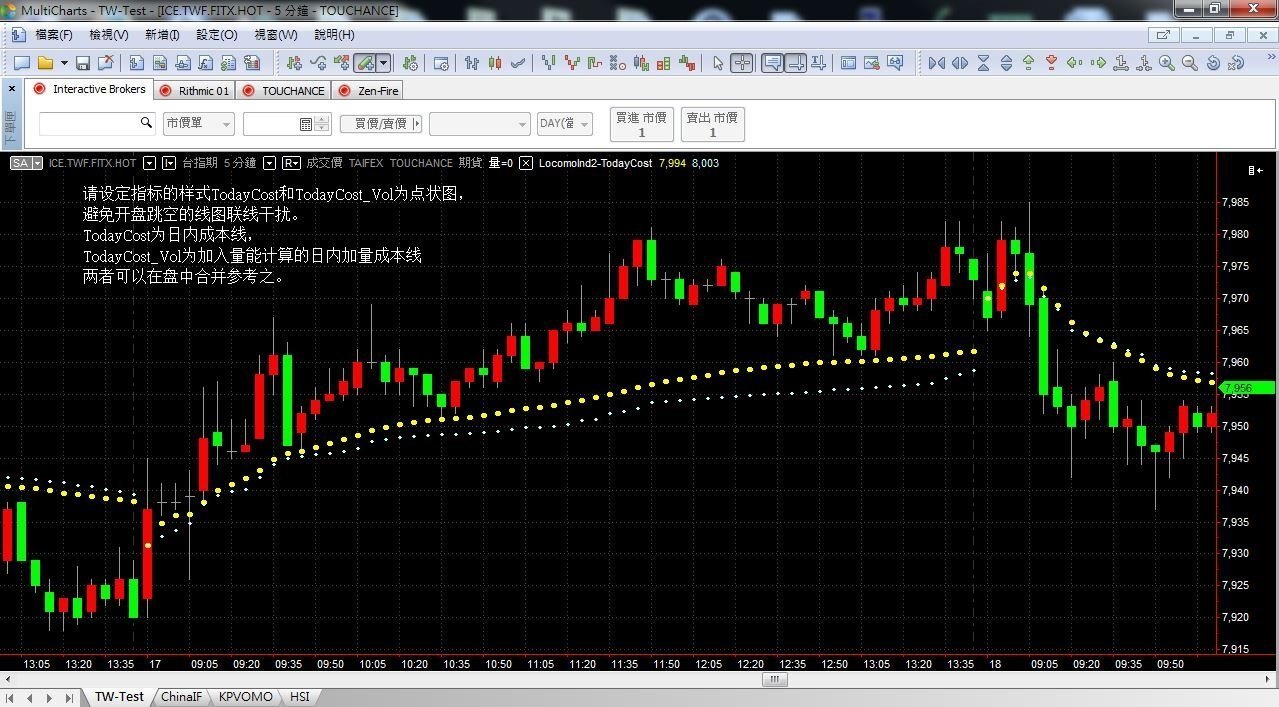
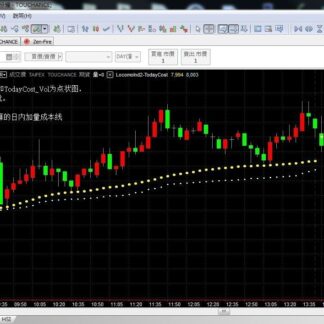
Please set the style of the indicator TodayCost and TodayCost_Vol to be dot graphs to avoid the interference of the opening jump if using line graph.
TodayCost is the intraday cost line.
TodayCost_Vol is the intraday incremental cost line for adding volume factor.
The two can be combined for reference.
商品評價
目前沒有評價。