描述
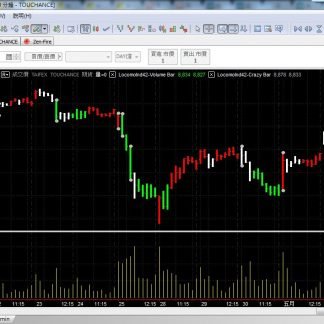
這也是一個很特別的Multicharts指標,
它使用了較少人會使用的量能下去計算,
將K線以紅、綠、白三種顏色來呈現,
清楚地讓交易員知道目前加計量能之後,行情所推動的方向。
同時該組指標另外還附贈了另外一個指標Crazy Bar,
它會將突兀異常K線的上下點標記出來,
提醒交易員目前的行情開始出現較大的變化了,
兩者搭配起來,在操作上會更加如虎添翼。
This is also a very specific indicator of Multicharts.
It uses the amount of volume that fewer people would use to calculate.
Presenting the bars in red, green and white.
Clearly let traders know the direction in which the market is being driven by the current volume.
An additional indicator, ‘Crazy Bar’, is also attached to this set of indicators.
It marks the upper and lower points of the abnormal bars.
Reminding traders that the current market is starting to change in a big way.
When combined with the two indicators, the operation will be more like a tiger with wings.