描述
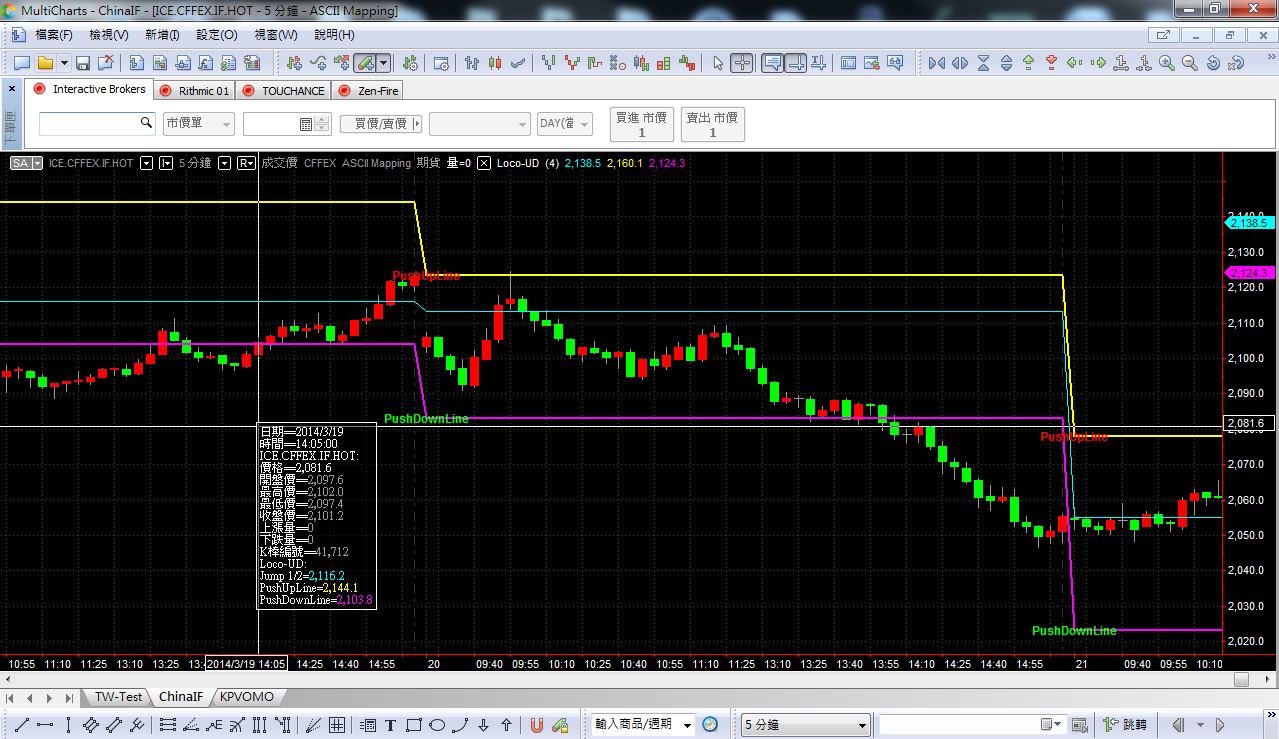
這是一個Multicharts的日內指標。
來自一位有名的專職交易前輩經驗而生成。
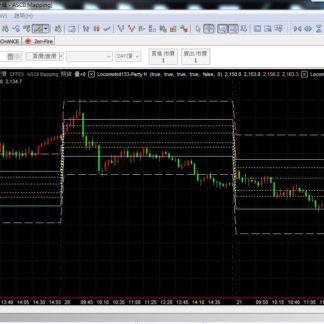
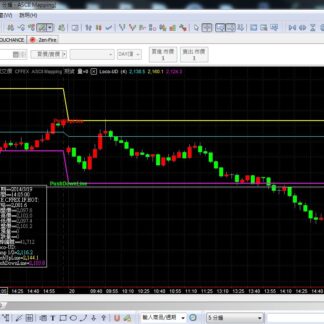
它可以在每天開盤的時候,自動計算當天走勢可能的上下限界。
當接近限界卻無法站上時,有可能這就是當天的最高/最低價。
當行情尚未突破限界前,走勢位於震盪的可能性居多。
或是當突破限界時,有可能代表的是,當天已走出了一個方向出來。
本日內指標可以提供給交易員,
對於一個當天走勢,很簡易卻很實用的分析方向參考。
This is an intraday indicator of Multicharts .
Generated from the experience of a famous full-time trading expert.
It can automatically calculate the possible upper and lower boundaries of the day’s movement when the market opens every day.
When it gets close to the boundary price but cannot get break out it, it may be the highest/lowest price of the day. (For Reversal trading)
When the market not break out the boundary yet, it is likely to be in consolidation not trend.
Or when it breaks out the boundary, it may represent that this day has a trend direction.(For Trend Following trading)
This indicator can provide to traders a very simple but practical reference for analyzing the direction of intraday.